ezplot3
(Not recommended) Easy-to-use 3-D parametric curve plotter
ezplot3 is not recommended. Use fplot3 instead. For more information, see Version History.
Syntax
Description
ezplot3(___,'animate') produces an animated trace
of the spatial curve. Use this option after any of the input argument combinations
in the previous syntaxes.
ezplot3( plots into
the axes specified by ax,___)ax instead of the current axes. Specify
the axes before any of the input argument combinations in any of the previous
syntaxes.
h = ezplot3(___) returns the plotted objects. Use
h to modify properties of the plot after creating it.
Examples
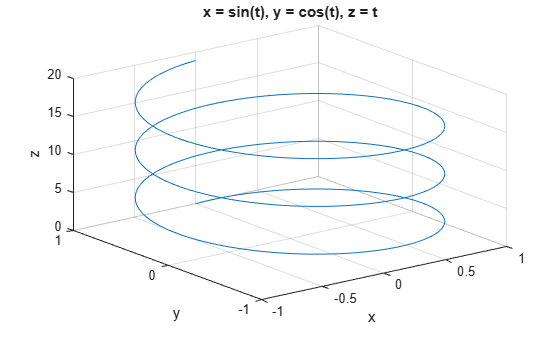
Plot this parametric curve over the domain .
ezplot3('sin(t)','cos(t)','t',[0,6*pi])