Create Image Histogram
This example shows how to create a histogram for an image using the imhist function. An image histogram is a chart that shows the distribution of intensities in an indexed or grayscale image. The imhist function creates a histogram plot by defining n equally spaced bins, each representing a range of data values, and then calculating the number of pixels within each range. You can use the information in a histogram to choose an appropriate enhancement operation. For example, if an image histogram shows that the range of intensity values is small, you can use an intensity adjustment function to spread the values across a wider range.
Read an image into the workspace and display it.
I = imread('rice.png');
imshow(I)
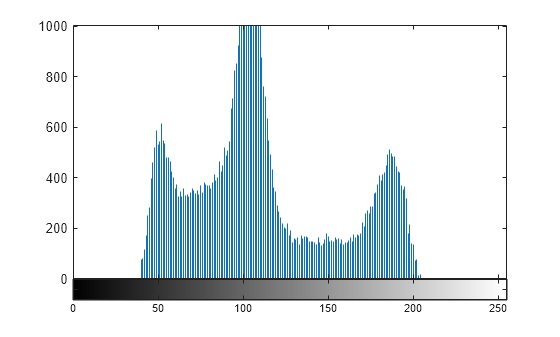
Create the histogram. For the example image, showing grains of rice, imhist creates a histogram with 64 bins. The imhist function displays the histogram, by default. The histogram shows a peak at around 100, corresponding to the dark gray background in the image.
figure;
imhist(I);