Change Fill Colors for Contour Plot
This example shows how to change the colors used in a filled contour plot.
Change Colormap
Set the colors for the filled contour plot by changing the colormap. Pass the predefined colormap name, hot, to the colormap function.
[X,Y,Z] = peaks;
figure
contourf(X,Y,Z,20)
colormap(hot)
title('Hot Colormap')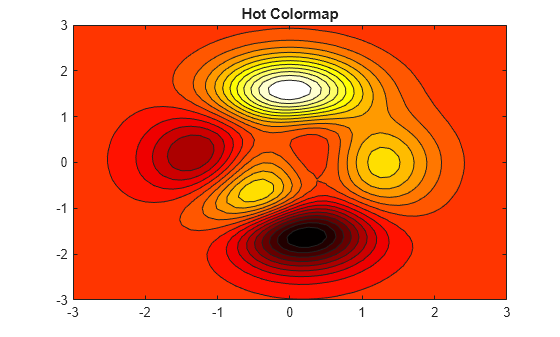
Control Mapping of Data Values to Colormap
Use only the colors in the center of the hot colormap by setting the colormap limits to a range much larger than the range of values in matrix Z. The clim function controls the mapping of data values into the colormap. Use this function to set the colormap limits.
clim([-20,20])
title('Center of Hot Colormap')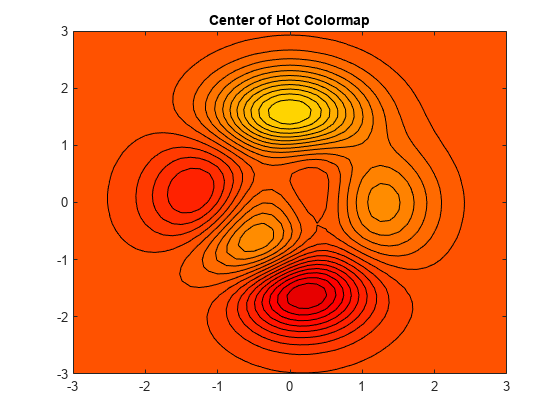
Before R2022a, change the colormap limits using caxis([-20 20]).