Save Figure with Specific Size, Resolution, or Background Color
To save plots for including in documents, such as publications or slide presentations,
use the exportgraphics function. This function enables you to save
plots at the appropriate size, resolution, and background color for your document. The
saved content is tightly cropped around the axes with minimal white space. All UI
components and adjacent containers such as panels are excluded from the saved
content.
Specify Resolution
To save a figure as an image at a specific resolution, call the exportgraphics function, and specify the
'Resolution' name-value pair argument. By default, images are
saved at 150 dots per inch (DPI).
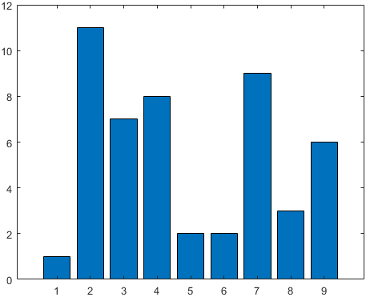
For example, create a bar chart and get the current figure. Then save the figure as a 300-DPI PNG file.
bar([1 11 7 8 2 2 9 3 6])
f = gcf;
exportgraphics(f,'barchart.png','Resolution',300)
Alternatively, you can specify the axes instead of the figure as the first
argument to the exportgraphics
function.
ax = gca;
exportgraphics(ax,'barchartaxes.png','Resolution',300)
Specify Size
The exportgraphics function captures content at the same
width and height as it is displayed on your screen. If you want to change the width
and height, then adjust the size of the content displayed in the figure. One way to
do this is to create the plot in a tiled chart layout at the desired size without
any padding. Then pass the layout to the exportgraphics
function.
For example, to save a bar chart as a 3-by-3 inch square image, start by creating
a 1-by-1 tiled chart layout t, and set the
'Padding' name-value pair argument to
'tight'.
t = tiledlayout(1,1,'Padding','tight');
Before R2021a: Set 'Padding' to
'none'.
Set the Units property of t to inches.
Then set the OuterPosition property of t to
[0.25 0.25 3 3]. The first two numbers in the vector position
the layout at 0.25 inches from the left and bottom edges of the
figure. The last two numbers set the width and height of the layout to 3
inches.
t.Units = 'inches';
t.OuterPosition = [0.25 0.25 3 3];
Next, create an axes object by calling the nexttile function. Then create a bar chart in the
axes.
nexttile;
bar([1 11 7 8 2 2 9 3 6])
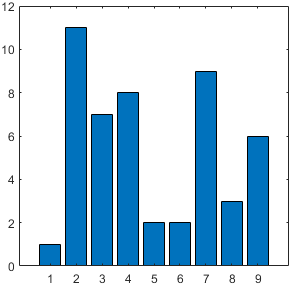
Save the layout as a 300-DPI JPEG file by passing t to the
exportgraphics function. The resulting image is approximately
3 inches square.
exportgraphics(t,'bar3x3.jpg','Resolution',300)
An alternative way to change the size is to save the content as a vector graphics
file. Then you can resize the content in your document. To save the content as a
vector graphics file, call the exportgraphics function and set
the 'ContentType' name-value pair argument to
'vector'. For example, create a bar chart, and save the
figure as a PDF file containing vector graphics. All embeddable fonts are included
in the
PDF.
bar([1 11 7 8 2 2 9 3 6])
f = gcf;
exportgraphics(f,'barscalable.pdf','ContentType','vector')
Specify Background Color
By default, the exportgraphics function saves content with a
white background. You can specify a different background by setting the
BackgroundColor name-value pair argument. These are the
possible values:
'current'— Uses the color of the axes parent container (such as a figure or a panel).'none'— Sets the background color to transparent or white, depending on the file format and the value ofContentType:Transparent — For files with
ContentType='vector'White — For image files, or when
ContentType='image'
A custom color, specified as an RGB triplet such as
[1 0
                                0]
, a hexadecimal color code such as#FF0000, or a named color such as'red'.
For example, create a bar chart, and save the figure as a PDF file with a transparent background.
bar([1 11 7 8 2 2 9 3 6])
f = gcf;
exportgraphics(f,'bartransparent.pdf','ContentType','vector',...
               'BackgroundColor','none')
Preserve Axis Limits and Tick Values
Occasionally, the exportgraphics function saves your content
with different axis limits or tick values depending on the size of the font and the
resolution of the file. To keep the axis limits and tick values from changing, set
the tick value mode and limit mode properties on the axes to
'manual'. For example, when plotting into Cartesian axes, set
the tick value and limit mode properties for the x-,
y-, and z-axis.
bar([1 10 7 8 2 2 9 3 6])
ax = gca;
ax.XTickMode = 'manual';
ax.YTickMode = 'manual';
ax.ZTickMode = 'manual';
ax.XLimMode = 'manual';
ax.YLimMode = 'manual';
ax.ZLimMode = 'manual';
exportgraphics(ax,'barticks.png')
For polar plots, set the RTickMode,
ThetaTickMode, RLimMode, and
ThetaLimMode properties on the polar axes to
'manual'.
See Also
Functions
Properties
Related Topics
You can also select a web site from the following list:
Americas
- América Latina (Español)
- Canada (English)
- United States (English)
Europe
- Belgium (English)
- Denmark (English)
- Deutschland (Deutsch)
- España (Español)
- Finland (English)
- France (Français)
- Ireland (English)
- Italia (Italiano)
- Luxembourg (English)
- Netherlands (English)
- Norway (English)
- Österreich (Deutsch)
- Portugal (English)
- Sweden (English)
- Switzerland
- United Kingdom (English)