brush
Interactively mark data values in a chart
Description
Data brushing allows you to mark data values in a chart using a color of your choice. You can mark individual data values, or select many values to mark using a selection rectangle. Once you have values marked, you can delete them or save them to a variable in the workspace. Brush marks will persist until you remove them, even if you pan, zoom, add data tips, or edit the plot.
Most charts support data brushing, including line, bar, area, histogram, and surface charts. Charts that support brushing typically display the Brush data button in the axes toolbar.
Creation
Description
brush on turns on brushing in the current figure. With brushing
on, mark a single data value by clicking on it. Mark multiple data values by dragging a
selection rectangle around them. To add additional marks or remove unwanted marks, hold
the Shift key while brushing the values.
brush off turns off brushing. If there are existing brush marks
on the chart, this command will not remove them.
brush toggles the brush mode. For example, if brush mode is
disabled, then calling brush enables brush mode.
brush( sets the color for subsequent
brush marks. Setting the brush color does not affect current marks unless you brush
data, change the brush color, and then add or remove marks using the
Shift key. In this case, all marks update to the new color.color)
brush( sets the brush
mode for all axes in the specified figure for any of the previous syntaxes. For example,
to enable brush mode for all axes in the figure fig,___)fig, use
brush(fig,"on").
brush( sets the brush mode
for the specified axes. For example, to enable brush mode for the axes
ax,___)ax, use brush(ax,"on"). (since R2023a)
Before R2025a: Use this syntax with apps created in App
Designer or using the uifigure function.
Input Arguments
Brush mark color, specified as an RGB triplet, hexadecimal color code, color name, or short name. To create brush marks of a certain color, set the color property before brushing your data values. Setting the brush color does not affect current marks unless you brush data, change the brush color, and then add or remove marks using the Shift key. In this case, all marks update to the new color.
An RGB triplet is a three-element row vector
whose elements specify the intensities of the red, green, and blue components of the
color. The intensities must be in the range [0, 1]. For example, specify
color as [0.4 0.6 0.7]. Alternatively, you
can specify some common colors by name. This table lists the long and short color name
options and their equivalent RGB triplet values.
| Color Name | Short Name | RGB Triplet | Hexadecimal Color Code | Appearance |
|---|---|---|---|---|
"red" | "r" | [1 0 0] | "#FF0000" |
|
"green" | "g" | [0 1 0] | "#00FF00" |
|
"blue" | "b" | [0 0 1] | "#0000FF" |
|
"cyan"
| "c" | [0 1 1] | "#00FFFF" |
|
"magenta" | "m" | [1 0 1] | "#FF00FF" |
|
"yellow" | "y" | [1 1 0] | "#FFFF00" |
|
"black" | "k" | [0 0 0] | "#000000" |
|
"white" | "w" | [1 1 1] | "#FFFFFF" |
|
Here are the RGB triplets for the default colors MATLAB® uses in many types of plots.
| RGB Triplet | Appearance |
|---|---|
[0 0.4470 0.7410] |
|
[0.8500 0.3250 0.0980] |
|
[0.9290 0.6940 0.1250] |
|
[0.4940 0.1840 0.5560] |
|
[0.4660 0.6740 0.1880] |
|
[0.3010 0.7450 0.9330] |
|
[0.6350 0.0780 0.1840] |
|
This table lists the default color palettes for plots in the light and dark themes.
| Palette | Palette Colors |
|---|---|
Before R2025a: Most plots use these colors by default. |
|
|
|
You can get the RGB triplets and hexadecimal color codes for these palettes using
the orderedcolors and rgb2hex
functions. For example, get the RGB triplets for the "gem" palette
and convert them to hexadecimal color
codes.
RGB = orderedcolors("gem");
H = rgb2hex(RGB);
Before R2023b: Get the RGB triplets using RGB =
get(groot,"FactoryAxesColorOrder").
Before R2024a: Get the hexadecimal color codes using
H = compose("#%02X%02X%02X",round(RGB*255)).
Target figure, specified as a Figure object. Specifying a target
figure sets the mode for all current or future Axes children.
Target axes, specified as an Axes object.
Properties
Examples
Use brushing to mark data values in a scatter plot. First, plot random
x and y values. Then, turn on brushing and use
the mouse to drag a rectangle around some points. Click the Expand axes toolbar button to see the axes toolbar.
x = rand(20,1);
y = rand(20,1);
scatter(x,y)
brush("on")
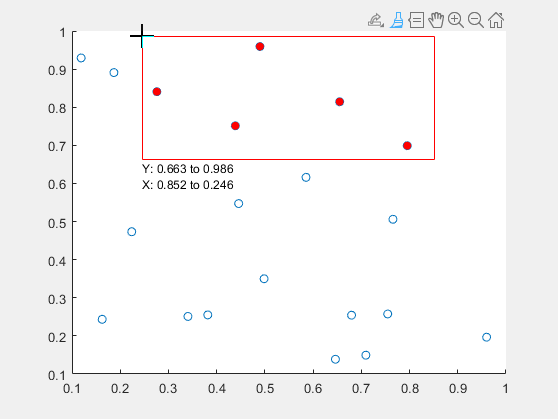
To modify which points you have marked without discarding the entire set, hold down the Shift key while brushing. Add or remove a single point by clicking on it. Add or remove several points by dragging a selection rectangle.
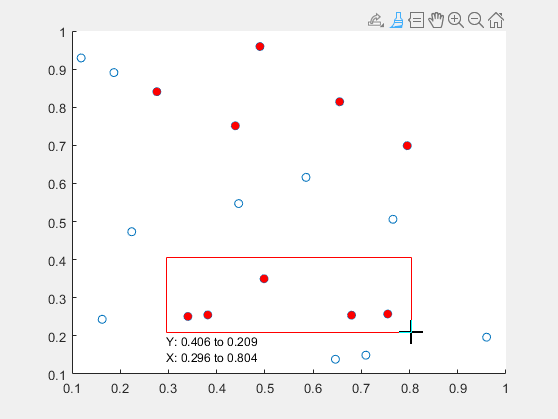
Clear all brush marks by clicking or dragging in an empty area of the axes.
Plot data values in a bar chart and create a brush object. Then, enable brushing and
set the brush color to "green" by updating the object's properties.
Finally, mark data values by including the maximum value of each bar in the selection
rectangle.
y = [75 91 105 123.5 131 150 179 203 226 249 281.5];
bar(y)
b = brush;
b.Enable = "on";
b.Color = "green";

Save brushed data in a variable by using the context menu. First, plot some
x and y values. Turn on brushing, and then mark
some data values.
x = linspace(0,5,30);
y = exp(x);
plot(x,y)
brush("on")
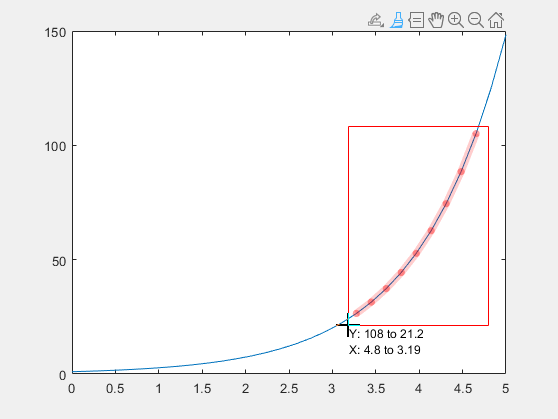
To store the brushed data in a variable, right-click on a brushed data value and
select Export Brushed from the context menu. When prompted, enter the variable name. In this
case, use the name brushedData. Finally, view the contents of
brushedData.
brushedData
brushedData =

    3.4483   31.4461
    3.6207   37.3633
    3.7931   44.3940
    3.9655   52.7475
    4.1379   62.6730
    4.3103   74.4662
    4.4828   88.4784
    4.6552  105.1273
    4.8276  124.9091
Remove brushed data from a chart by using the context menu. First, plot some
x and y values. Turn on brushing, and then mark
some data values.
x = linspace(0,5,30);
y = exp(x);
scatter(x,y)
brush("on")
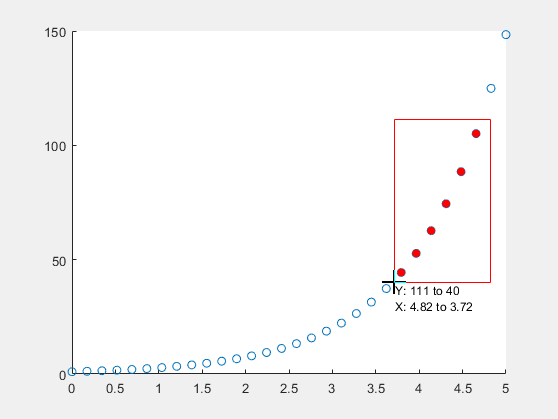
To remove the brushed data from the chart, right-click on a brushed data value and select Remove Brushed from the context menu.

More About
Data linking automatically updates figures as plotted variables change.
Enable data linking for a figure using the command linkdata on. Brush
marks created on a linked graph will appear on other linked graphs that display the same
variables. This brushing occurs even if other plots are not in brush mode.

When you turn on data linking for a figure, existing brush marks are replaced by the marks in other linked figures. If you turn on data linking and there are no other linked figures, then existing brush marks disappear. If you brush a graph and then turn off data linking, the brush marks remain.
These conditions apply:
Brush marks appear in the same color in all linked charts. The brush color that displays in linked charts is the brush color associated with the graph you are brushing.
The linked variable must not be complex. You can brush complex data values, but brush marks will not appear in the other linked charts. For more information about linking complex variables, see
linkdata.
Brush marks on a surface chart display differently when the surface chart has linked
data. When you brush one face of a linked surface chart, all faces with the same
yData are also brushed. This behavior allows you to investigate
relationships between columns of data distributed among multiple rows. These images
illustrate the difference between brushing unlinked and linked surface charts.

Tips
To brush a histogram chart, you must first turn on data linking.
Alternative Functionality
Axes Toolbar
For some charts, enable brush mode by clicking the Brush data button in the axes toolbar.