cellplot
Graphically display structure of cell array
Syntax
cellplot(c)

cellplot(c, 'legend')

handles = cellplot(c)
Description
cellplot(c) displays a
figure window that graphically represents the contents of c.
Filled rectangles represent elements of vectors and arrays, while
scalars and short character vectors are displayed as text.
cellplot(c, 'legend') places
a colorbar next to the plot labelled to identify the data types in c.
handles = cellplot(c) displays
a figure window and returns a vector of surface handles.
Limitations
The cellplot function can display only
two-dimensional cell arrays.
Examples
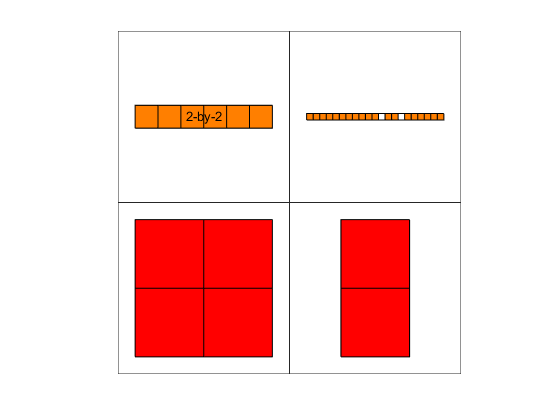
Consider a 2-by-2 cell array containing a matrix, a vector, and two character vectors:
c{1,1} = '2-by-2';
c{1,2} = 'eigenvalues of eye(2)';
c{2,1} = eye(2);
c{2,2} = eig(eye(2));
The command cellplot(c) produces
Version History
Introduced before R2006a
You can also select a web site from the following list:
Americas
- América Latina (Español)
- Canada (English)
- United States (English)
Europe
- Belgium (English)
- Denmark (English)
- Deutschland (Deutsch)
- España (Español)
- Finland (English)
- France (Français)
- Ireland (English)
- Italia (Italiano)
- Luxembourg (English)
- Netherlands (English)
- Norway (English)
- Österreich (Deutsch)
- Portugal (English)
- Sweden (English)
- Switzerland
- United Kingdom (English)