rlim
Set or query r-axis limits for polar axes
Description
Specify Limits
rlim( specifies the
r-axis limits for the current polar axes. Specify
limits)limits as a two-element vector of the form [rmin
rmax], where rmax is a numeric value greater
than rmin.
rlim( specifies automatic
or manual limit selection. The limitmode)limitmode can have either of
two values:
"auto"— Enable automatic limit selection. MATLAB® chooses the r-axis limits."manual"— Freeze the r-axis limits at their current value. Use this option if you want to retain the current limits when adding new data to the polar axes using thehold oncommand.
Query Limits
m = rlim("mode")'auto' or
'manual'. By default, the mode is automatic unless you
specify limits or set the mode to manual.
Examples
Specify r-Axis Limits
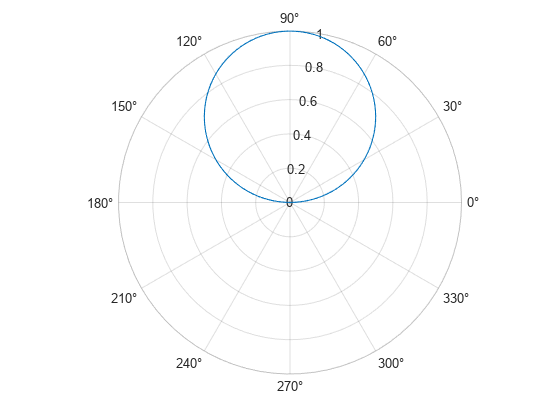
Create a polar plot and change the r-axis limits.
theta = 0:0.01:2*pi;
rho = sin(2*theta).*cos(2*theta);
polarplot(theta,rho)
rlim([0 1])

Set the limits back to the original values.
rlim('auto')
Plot Negative Radius Values
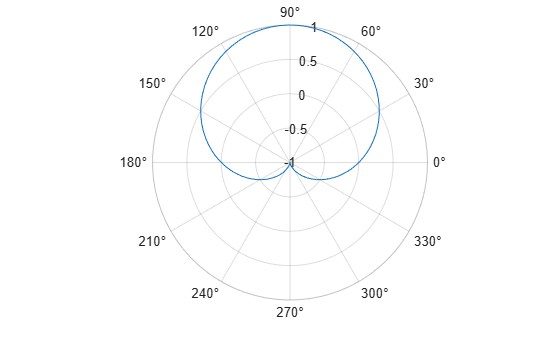
Create a polar plot using negative radius values. By default, polarplot reflects negative values through the origin.
theta = linspace(0,2*pi);
rho = sin(theta);
polarplot(theta,rho)
Change the limits of the r-axis so it ranges from -1 to 1.
rlim([-1 1])
Return r-Axis Limits
Create a polar plot and return the r-axis limits.
theta = 0:0.01:2*pi;
rho = sin(2*theta).*cos(2*theta);
polarplot(theta,rho)
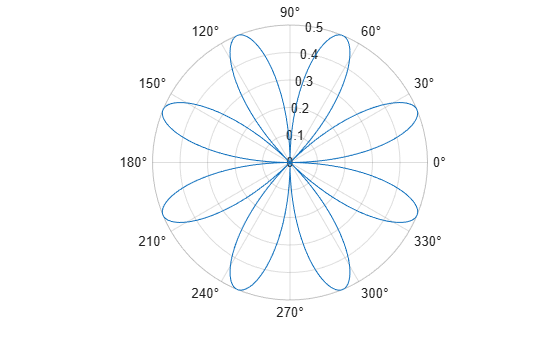
rl = rlim
rl = 1×2

         0    0.5000
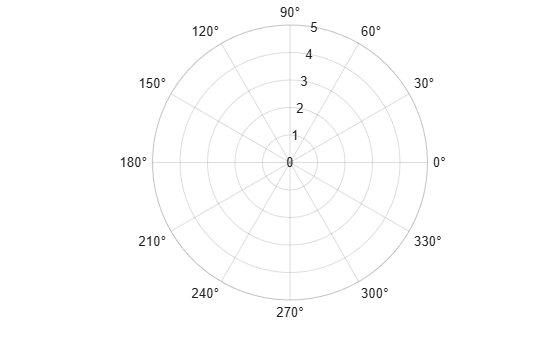
Specify r-Axis Limits for Specific Polar Axes
Set the limits for a specific polar axes by specifying the polar axes object as the first input to rlim. Otherwise, rlim sets the limits for the current axes.
pax = polaraxes;
rlim(pax,[0 5])
Input Arguments
Output Arguments
Version History
Introduced in R2016a
You can also select a web site from the following list:
Americas
- América Latina (Español)
- Canada (English)
- United States (English)
Europe
- Belgium (English)
- Denmark (English)
- Deutschland (Deutsch)
- España (Español)
- Finland (English)
- France (Français)
- Ireland (English)
- Italia (Italiano)
- Luxembourg (English)
- Netherlands (English)
- Norway (English)
- Österreich (Deutsch)
- Portugal (English)
- Sweden (English)
- Switzerland
- United Kingdom (English)