xticklabels
Set or query x-axis tick labels
Syntax
Description
xticklabels( sets the
x-axis tick labels for the
current axes. Specify labels)labels as a string array or a cell
array of character vectors; for example,
{'January','February','March'}. If you specify the
labels, then the x-axis tick values and tick labels no
longer update automatically based on changes to the axes.
xl = xticklabels
xticklabels('auto') sets an automatic mode,
enabling the axes to determine the x-axis tick
labels. Use this option if you set the labels and then want to set
them back to the default values.
xticklabels('manual') sets a manual mode,
freezing the x-axis tick labels at the current
values.
m = xticklabels('mode')'auto' or 'manual'.
By default, the mode is automatic unless you specify the tick labels
or set the mode to manual.
Examples
Specify x-Axis Tick Values and Labels
Create a line plot. Display tick marks along the x-axis at the values 0, 5, and 10. Then specify a label for each tick mark.
x = linspace(0,10);
y = x.^2;
plot(x,y)
xticks([0 5 10])
xticklabels({'x = 0','x = 5','x = 10'})
Display x-Axis Tick Labels in Terms of Pi
Create a line plot. Specify the x-axis limits and display tick marks along at the x-axis at increments of .
x = linspace(0,6*pi);
y = sin(x);
plot(x,y)
xlim([0 6*pi])
xticks(0:pi:6*pi)

MATLAB® labels the tick marks with the numeric values. Change the labels to show the symbol by specifying text for each label.
xticklabels({'0','\pi','2\pi','3\pi','4\pi','5\pi','6\pi'})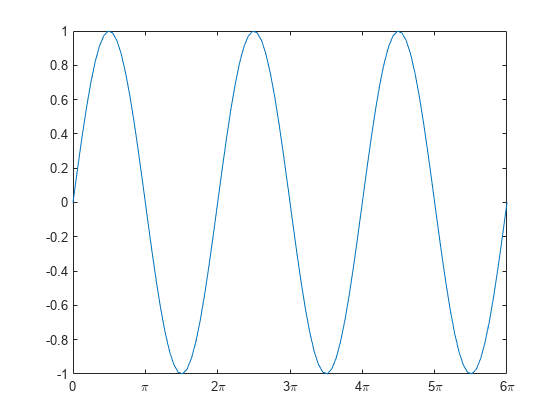
Specify x-Axis Tick Labels for Specific Axes
Starting in R2019b, you can display a tiling of plots using the tiledlayout and nexttile functions. Call the tiledlayout function to create a 2-by-1 tiled chart layout. Call the nexttile function to create the axes objects ax1 and ax2. Create two plots of random data. Set the x-axis tick values and labels for the second plot by specifying ax2 as the first input argument.
tiledlayout(2,1)
ax1 = nexttile;
plot(ax1,rand(3))

ax2 = nexttile;
plot(ax2,rand(3))
xticks(ax2,[1 2 3])
xticklabels(ax2,{'one','two','three'})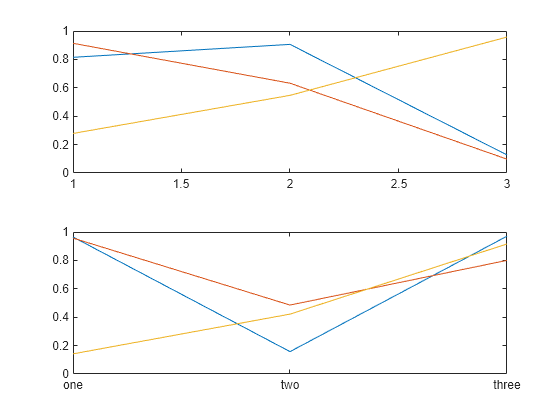
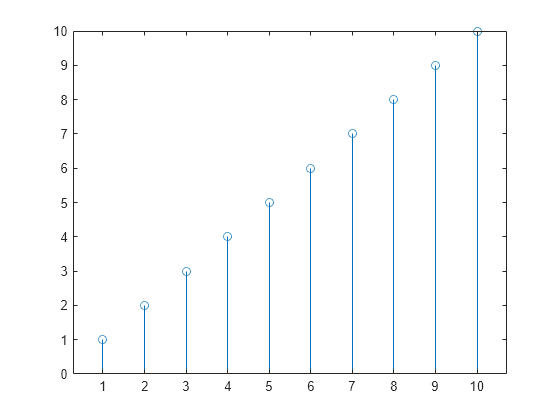
Set x-Axis Tick Labels Back to Default Labels
Create a stem chart, and specify the x-axis tick values and corresponding labels. Then set the x-axis tick values and labels back to the default values.
stem(1:10)
xticks([1 4 6 10])
xticklabels({'A','B','C','D'})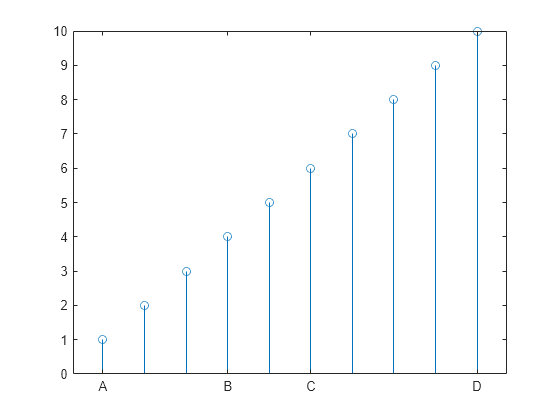
xticks('auto')
xticklabels('auto')
Remove x-Axis Tick Labels
Remove the tick labels along the x-axis by specifying the tick labels as an empty array.
plot(rand(5))
xticklabels({})
Input Arguments
Output Arguments
More About
Tick Labels
The tick labels are the labels that you see
next to each tick mark. The tick values are the locations along the x-axis
where the tick marks appear. Set the values using the xticks function. Set the corresponding
labels using the xticklabels function.

Algorithms
The xticklabels function sets and queries
several axes properties related to the x-axis
tick labels.
XTickLabel— Property that stores the text for the x-axis tick labels.XTickLabelMode— Property that stores the x-axis tick label mode. When you set the x-axis tick labels usingxticklabels, this property changes to'manual'.XTickMode— Property that stores the x-axis tick value mode. When you set the x-axis tick labels usingxticklabels, this property changes to'manual'.
Version History
Introduced in R2016b
You can also select a web site from the following list:
Americas
- América Latina (Español)
- Canada (English)
- United States (English)
Europe
- Belgium (English)
- Denmark (English)
- Deutschland (Deutsch)
- España (Español)
- Finland (English)
- France (Français)
- Ireland (English)
- Italia (Italiano)
- Luxembourg (English)
- Netherlands (English)
- Norway (English)
- Österreich (Deutsch)
- Portugal (English)
- Sweden (English)
- Switzerland
- United Kingdom (English)