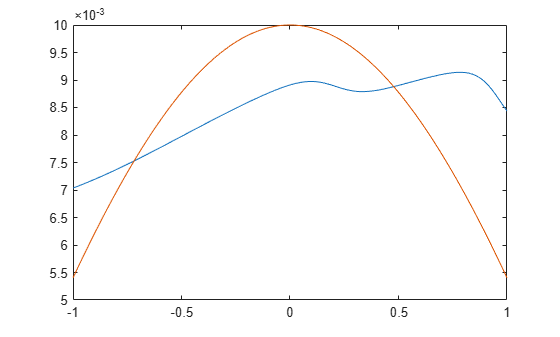
Normalize Errors of Multiple Outputs
The most common performance function used to train neural networks is mean squared error (mse). However, with multiple outputs that have different ranges of values, training with mean squared error tends to optimize accuracy on the output element with the wider range of values relative to the output element with a smaller range.
For instance, here two target elements have very different ranges:
x = -1:0.01:1;
t1 = 100*sin(x);
t2 = 0.01*cos(x);
t = [t1; t2];
The range of t1 is 200 (from a minimum of
-100 to a maximum of 100), while the range of t2 is
only 0.02 (from -0.01 to 0.01). The range of t1 is
10,000 times greater than the range of t2.
If you create and train a neural network on this to minimize mean squared error, training favors the relative accuracy of the first output element over the second.
net = feedforwardnet(5);
net1 = train(net,x,t);
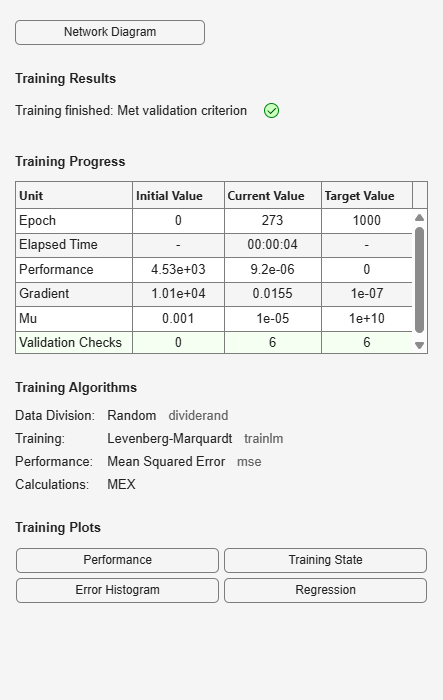
y = net1(x);
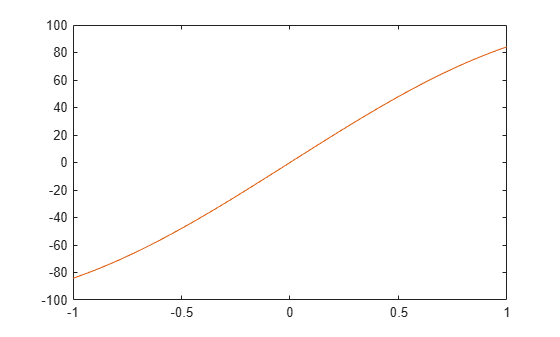
Here you can see that the network has learned to fit the first output element very well.
figure(1)
plot(x,y(1,:),x,t(1,:))
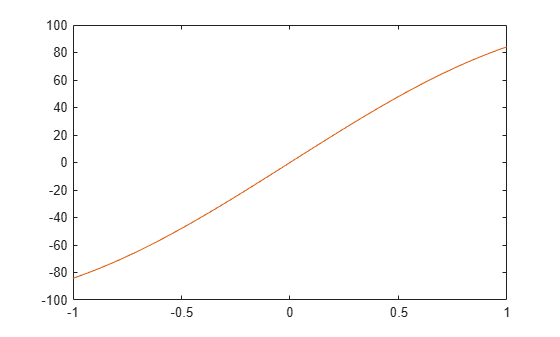
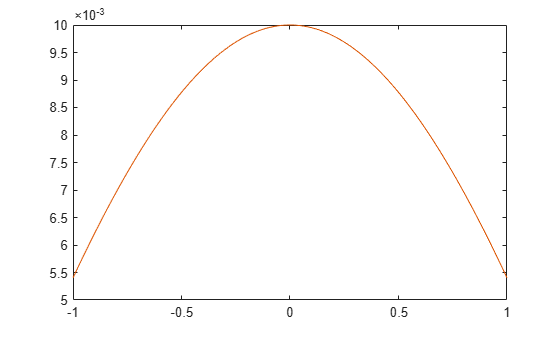
However, the second element’s function is not fit nearly as well.
figure(2)
plot(x,y(2,:),x,t(2,:))
To fit both output elements equally well in a relative sense,
set the normalization performance parameter to 'standard'.
This then calculates errors for performance measures as if each output
element has a range of 2 (i.e., as if each output element’s
values range from -1 to 1, instead of their differing ranges).
net.performParam.normalization = 'standard';
net2 = train(net,x,t);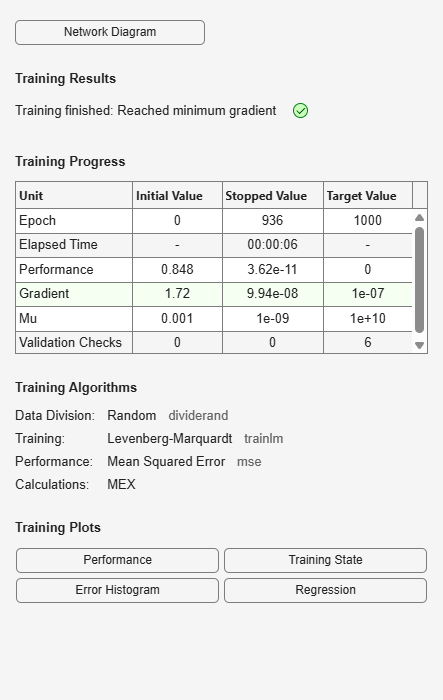
y = net2(x);
Now the two output elements both fit well.
figure(3)
plot(x,y(1,:),x,t(1,:))
figure(4)
plot(x,y(2,:),x,t(2,:))
You can also select a web site from the following list:
Americas
- América Latina (Español)
- Canada (English)
- United States (English)
Europe
- Belgium (English)
- Denmark (English)
- Deutschland (Deutsch)
- España (Español)
- Finland (English)
- France (Français)
- Ireland (English)
- Italia (Italiano)
- Luxembourg (English)
- Netherlands (English)
- Norway (English)
- Österreich (Deutsch)
- Portugal (English)
- Sweden (English)
- Switzerland
- United Kingdom (English)