Decide How to Visualize Simulation Data
Visualizing simulation data throughout the modeling process helps you understand and tune model behavior. Simulink® offers several complementary visualization tools you can use throughout the modeling process. Some visualization tools also offer the ability to save simulation data. Learn about each technique so you can choose the right tools to visualize your model data.
Simulation Data Inspector — View, analyze, and compare logged data throughout the modeling process.
Scope block, Floating Scope block, and Scope Viewer — Debug and analyze data using a block-based tool with capabilities similar to a bench-top oscilloscope.
Record block — Visualize data logged to the workspace, a file, or both.
Dashboard blocks — Build an interactive interface to tune and monitor a model.
Port value labels — View instantaneous signal values in the block diagram.
Custom MATLAB® visualization — Write MATLAB code to visualize data.
Simulation Data Inspector
You can use the Simulation Data Inspector for most visualization tasks. The Simulation Data Inspector integrates with data logging in your model and works well for visualizing many signals throughout a model. Use comparisons in the Simulation Data Inspector to prototype, debug, tune, calibrate, and test your models. The Simulation Data Inspector supports:
Viewing signals during simulation
Logging, importing, and exporting data
Configurable subplot layouts and visualization settings
Viewing data using multiple visualization options, including maps and XY plots
Post-processing and data analysis using comparisons with tolerance values
Saving plots and data to share or archive results
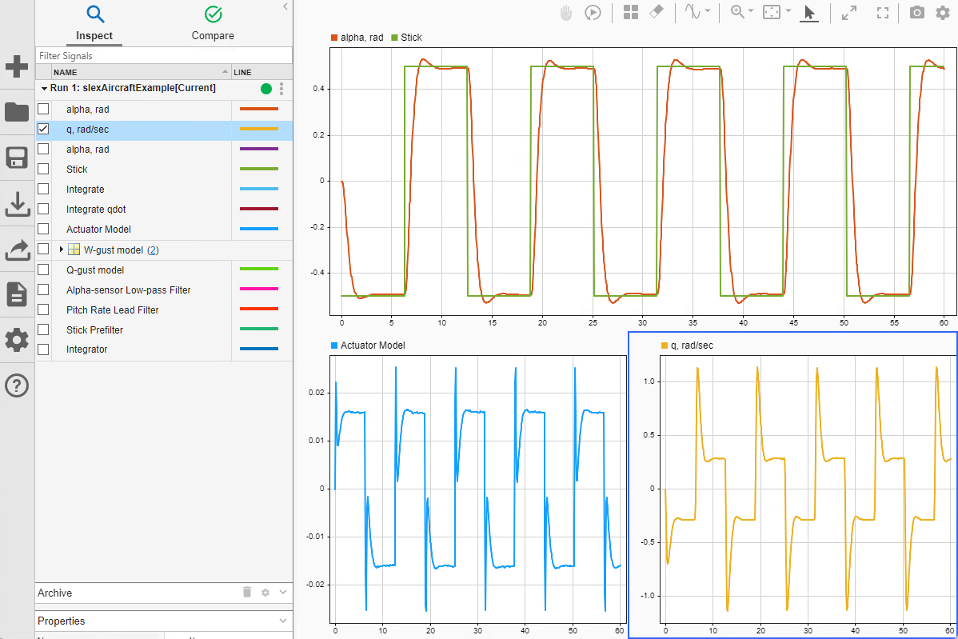
To visualize simulation data using the Simulation Data Inspector, log data in the model. When you log signals and outputs, the logged data is automatically available in the Simulation Data Inspector during and after simulation. In the model Configuration Parameters, select Data Import/Export > Record logged workspace data in Simulation Data Inspector to make logged states and Simscape™ data available in the Simulation Data Inspector after simulation. When you want to view signals without logging the data, consider using a Scope block, the Floating Scope block, or a Scope Viewer.
Open the Simulation Data Inspector from Simulation > Data Inspector or by clicking a signal logging badge. When you open the Simulation Data Inspector by clicking the logging badge on a signal, the signal is automatically plotted.
For more information, see Simulation Data Inspector.
Scope Blocks and the Scope Viewer
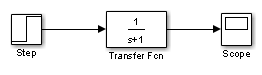
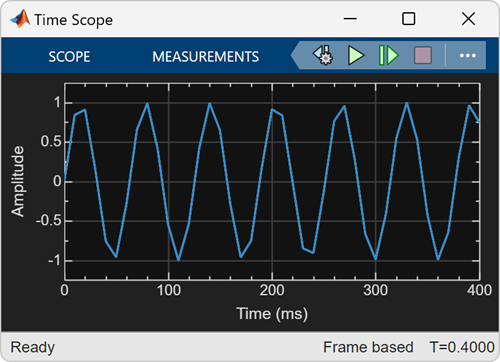
Scope blocks, Floating Scope blocks, and the Scope Viewer visualize connected signals in a similar way as a bench-top oscilloscope. The scope blocks and Scope Viewer use the same interface to visualize and analyze connected signals. The interface is similar to other domain-specific tools, such as the Spectrum Analyzer (DSP System Toolbox) and Array Plot (DSP System Toolbox) blocks. Scope blocks are easy to add and connect in your model, and you do not need to log data in order to view signal data.
Scope blocks, Floating Scope blocks, and the Scope Viewer support:
Viewing signals during simulation, including rapid accelerator simulations
Simple connection and accessibility for lightweight debugging
Signal visualization without logging
Optional signal logging
Starting simulations from the visualization interface using playback controls
Oscilloscope measurements, including cursors and triggers. Additional measurements are available when you have a Simscape or DSP System Toolbox™ license
Configurable plots and display
Configurable triggers to capture events
Use the Scope block, the Floating Scope block, and the Scope Viewer for prototyping and lightweight debugging. For example, in the early stages of model development, you can connect a Scope block to a signal to quickly verify component behavior. By adding triggers, you can tune a specific peak or other artifact in a signal. A Scope block may or may not be permanent in your model.
When you need to view data for signals throughout a model hierarchy, consider using the Simulation Data Inspector, especially if you already log the signals you want to view.
For more information, see Scope Blocks and Scope Viewer Overview.
Record Block
You can use the Record block to view connected signal data that you record to the workspace, a file, or both the workspace and a file.
The Record block supports:
Viewing signals logged using the Record block during simulation
Logging data to the workspace, a file, and the Simulation Data Inspector
Streaming data to the Simulation Data Inspector during simulation
Viewing data using multiple visualization options, including maps and XY plots
Starting simulations while viewing data in the Record block using simulation controls, such as the Run button

Connect signals to the Record block to log data to the workspace or a file. To view simulation data logged using the Record block, double-click the block. You can modify the plot layout and view data using several visualizations, including sparklines plots, time plots, and XY plots. Data logged to the Record block is automatically streamed to the Simulation Data Inspector during simulation. When you want to view signals without logging the data, consider using a Scope block, the Floating Scope block, or a Scope Viewer.
For more information, see Log Data to the Workspace and a File Using the Record Block.
Dashboard Blocks
The Dashboard library includes control blocks you can use to tune variables and parameters in your model and visualization blocks you can use to view signal data. Use dashboard blocks to view instantaneous signal data and build an interactive interface for your model.

You can use dashboard block controls to modify the values of variables and tunable parameters in your model during simulation. Visualization dashboard blocks are updated continuously throughout simulation. When you need to debug a model that uses dashboard blocks, consider using simulation pacing or simulation stepping to slow the simulation so you can view the instantaneous signal values. You can also promote dashboard blocks to one or more panels so the interactive dashboard can follow you throughout a model hierarchy as you design and debug your model. For more information, see:

The Dashboard Scope block provides a simple view of a signal over time. You can zoom, pan, and add cursors to a Dashboard Scope block through the context menu. For more debugging and analysis capabilities, use a Scope block or log data to the Simulation Data Inspector.
For more information about using Dashboard blocks, see Tune and Visualize Your Model with Dashboard Blocks.
Port Value Labels
To view signal values in the block diagram during simulation, use port value labels. Port value labels can supplement existing visualizations, especially while prototyping and debugging models. For example, you can view signal values on port value labels as you step through a simulation while visualizing the temporal behavior using a Scope block. You can also use port value labels on their own to support debugging without adding any blocks to your model or logging data.
To display a signal value, right-click the signal and select Show Port Value Label On Selected Signal.

When viewing signal data using port value labels, consider using simulation pacing or stepping through the simulation. For more information, see Simulation Pacing Options and Step Through Simulation.
For more information, see View Signal Values Using Port Value Labels.
Custom MATLAB Visualizations
When you log simulation data to the workspace or a file, you can write MATLAB code and scripts to create custom visualizations. You can log signals, outputs, and states in a model, and you can also enable data logging for signals connected to Scope Viewers, Floating Scope blocks and Scope blocks. For more information about logging data in your model, see Save Simulation Data.
Note
When you post-process data using MATLAB code and scripts, you do not need to write custom MATLAB code to visualize the data. You can import the processed data into the Simulation Data Inspector for visualization alongside the logged data.
The visualization code you write can depend on the format of the logged data. By
default, logging uses the Dataset format and produces a single
simulation output. Logged data is returned to the workspace as a Simulink.SimulationOutput object
that contains a Simulink.SimulationData.Dataset
object for each type of logging used in the simulation. Each
Dataset object contains Simulink.SimulationData.Signal
objects that store the data for an individual signal as a timeseries object. For more
information, see Data Format for Logged Simulation Data.
When you log a signal, you can visualize the signal during simulation using custom MATLAB code. For more information, see Access Data in MATLAB Function During Simulation.
See Also
Tools
Blocks
Related Topics
You can also select a web site from the following list:
Americas
- América Latina (Español)
- Canada (English)
- United States (English)
Europe
- Belgium (English)
- Denmark (English)
- Deutschland (Deutsch)
- España (Español)
- Finland (English)
- France (Français)
- Ireland (English)
- Italia (Italiano)
- Luxembourg (English)
- Netherlands (English)
- Norway (English)
- Österreich (Deutsch)
- Portugal (English)
- Sweden (English)
- Switzerland
- United Kingdom (English)