predict
Predict labels using classification ensemble model
Description
labels = predict(ens,X,Name=Value)
[ also returns a matrix of classification scores indicating the likelihood that a label comes from a particular
class, using any of the input argument combinations in the previous syntaxes. For
each observation in labels,scores]
= predict(___)X, the predicted class label corresponds to
the maximum score among all classes.
Examples
Predict Class Labels Using Classification Ensemble
Load Fisher's iris data set. Determine the sample size.
load fisheriris
N = size(meas,1);
Partition the data into training and test sets. Hold out 10% of the data for testing.
rng(1); % For reproducibility
cvp = cvpartition(N,'Holdout',0.1);
idxTrn = training(cvp); % Training set indices
idxTest = test(cvp);    % Test set indices
Store the training data in a table.
tblTrn = array2table(meas(idxTrn,:));
tblTrn.Y = species(idxTrn);
Train a classification ensemble using AdaBoostM2 and the training set. Specify tree stumps as the weak learners.
t = templateTree('MaxNumSplits',1);
Mdl = fitcensemble(tblTrn,'Y','Method','AdaBoostM2','Learners',t);
Predict labels for the test set. You trained model using a table of data, but you can predict labels using a matrix.
labels = predict(Mdl,meas(idxTest,:));
Construct a confusion matrix for the test set.
confusionchart(species(idxTest),labels)
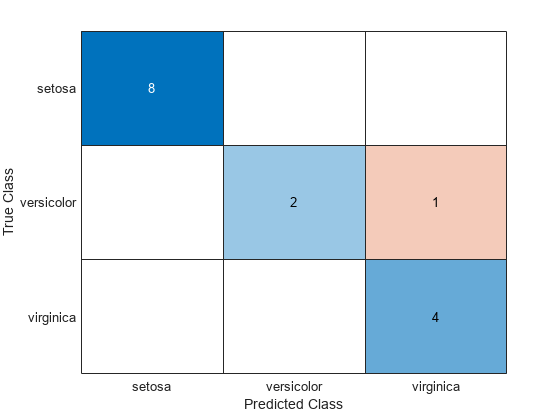
Mdl misclassifies one versicolor iris as virginica in the test set.
Assess Performance of Ensemble of Boosted Trees
Create an ensemble of boosted trees and inspect the importance of each predictor. Using test data, assess the classification accuracy of the ensemble.
Load the arrhythmia data set. Determine the class representations in the data.
load arrhythmia
Y = categorical(Y);
tabulate(Y)
Value Count Percent
1 245 54.20%
2 44 9.73%
3 15 3.32%
4 15 3.32%
5 13 2.88%
6 25 5.53%
7 3 0.66%
8 2 0.44%
9 9 1.99%
10 50 11.06%
14 4 0.88%
15 5 1.11%
16 22 4.87%
The data set contains 16 classes, but not all classes are represented (for example, class 13). Most observations are classified as not having arrhythmia (class 1). The data set is highly discrete with imbalanced classes.
Combine all observations with arrhythmia (classes 2 through 15) into one class. Remove those observations with an unknown arrhythmia status (class 16) from the data set.
idx = (Y ~= "16");
Y = Y(idx);
X = X(idx,:);
Y(Y ~= "1") = "WithArrhythmia";
Y(Y == "1") = "NoArrhythmia";
Y = removecats(Y);
Create a partition that evenly splits the data into training and test sets.
rng("default") % For reproducibility
cvp = cvpartition(Y,"Holdout",0.5);
idxTrain = training(cvp);
idxTest = test(cvp);
cvp is a cross-validation partition object that specifies the training and test sets.
Train an ensemble of 100 boosted classification trees using AdaBoostM1. Specify to use tree stumps as the weak learners. Also, because the data set contains missing values, specify to use surrogate splits.
t = templateTree("MaxNumSplits",1,"Surrogate","on");
numTrees = 100;
mdl = fitcensemble(X(idxTrain,:),Y(idxTrain),"Method","AdaBoostM1", ...
    "NumLearningCycles",numTrees,"Learners",t);
mdl is a trained ClassificationEnsemble model.
Inspect the importance measure for each predictor.
predImportance = predictorImportance(mdl);
bar(predImportance)
title("Predictor Importance")
xlabel("Predictor")
ylabel("Importance Measure")
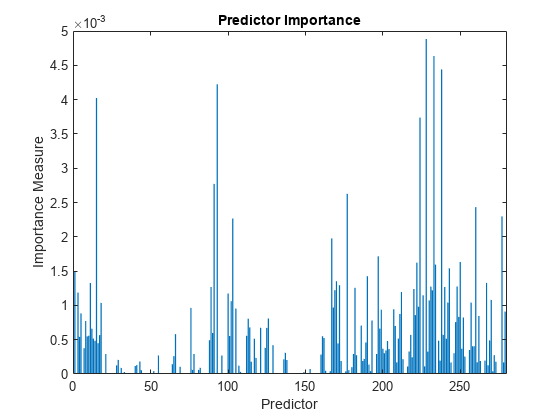
Identify the top ten predictors in terms of their importance.
[~,idxSort] = sort(predImportance,"descend");
idx10 = idxSort(1:10)
idx10 = 1×10
228 233 238 93 15 224 91 177 260 277
Classify the test set observations. View the results using a confusion matrix. Blue values indicate correct classifications, and red values indicate misclassified observations.
predictedValues = predict(mdl,X(idxTest,:));
confusionchart(Y(idxTest),predictedValues)
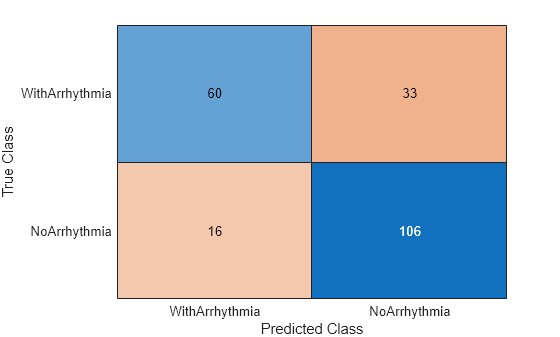
Compute the accuracy of the model on the test data.
error = loss(mdl,X(idxTest,:),Y(idxTest), ...
    "LossFun","classiferror");
accuracy = 1 - error
accuracy = 0.7731
accuracy estimates the fraction of correctly classified observations.
Input Arguments
Output Arguments
More About
Alternative Functionality
Simulink Block
To integrate the prediction of an ensemble into Simulink®, you can use the ClassificationEnsemble Predict block in the Statistics and Machine Learning Toolbox™ library or a MATLAB® Function block with the predict function. For
examples, see Predict Class Labels Using ClassificationEnsemble Predict Block and Predict Class Labels Using MATLAB Function Block.
When deciding which approach to use, consider the following:
If you use the Statistics and Machine Learning Toolbox library block, you can use the Fixed-Point Tool (Fixed-Point Designer) to convert a floating-point model to fixed point.
Support for variable-size arrays must be enabled for a MATLAB Function block with the
predictfunction.If you use a MATLAB Function block, you can use MATLAB functions for preprocessing or post-processing before or after predictions in the same MATLAB Function block.
Extended Capabilities
Version History
Introduced in R2011a
You can also select a web site from the following list:
Americas
- América Latina (Español)
- Canada (English)
- United States (English)
Europe
- Belgium (English)
- Denmark (English)
- Deutschland (Deutsch)
- España (Español)
- Finland (English)
- France (Français)
- Ireland (English)
- Italia (Italiano)
- Luxembourg (English)
- Netherlands (English)
- Norway (English)
- Österreich (Deutsch)
- Portugal (English)
- Sweden (English)
- Switzerland
- United Kingdom (English)