Execution Profiling for Real-Time Applications
This example shows how you can profile the task execution time and function execution time of your real-time application that is running on the target computer. Using that information, you can then tune its performance.
Profiling is especially useful if you configure your real-time application to take advantage of multicore processors on the target computer. To profile the real-time application:
In the Configuration Parameters dialog box for the model, enable the collection of function execution time data during execution.
Build, download, and execute the model.
Start and stop the profiler.
Display the profiler data.
The Execution Profiler and SLRT Overload Options block use different mechanisms to measure TET and do not generate identical TET values.
Note: You can also use the Simulink® Schedule Editor to partition the model. In the Simulink Editor, click the Modeling tab and select Design > Schedule Editor. For more information, see Create Partitions from a Rate-Based Model.
Configure Real-Time Application for Function Execution Profiling
The model is slrt_ex_mds_and_tasks. To open this model, open the subsystem models first:
slrt_ex_mds_subsystem1slrt_ex_mds_subsystem2slrt_ex_mds_and_tasks
1. Open model slrt_ex_mds_and_tasks.
2. In the top model, open the Configuration Parameters dialog box. Select Code Generation >> Verification.
3. For Measure function execution times, select Coarse (reference models and subsystems only). The Measure task execution time check box is selected and locked. Or, in the MATLAB Command Window, type:
set_param('slrt_ex_mds_and_tasks','CodeProfilingInstrumentation','Coarse');
4. Click OK. Save model slrt_ex_mds_and_tasks in a local folder.
Generate Real-Time Application Execution Profile
Generate profile data for model slrt_ex_mds_and_tasks on a multicore target computer.
You must have previously configured the target computer to take advantage of multiple cores and configured the model for task and function execution profiling.
1. Open, build, and download the model.
tg = slrealtime;
connect(tg);
model = 'slrt_ex_mds_and_tasks';
open_system(model);
modelSTF = getSTFName(tg);
set_param(model,"SystemTargetFile",modelSTF);
evalc('slbuild(model)');
load(tg,model);
setStopTime(tg,20);

When you include profiling, the Code Generation Report is generated by default. It contains links to the generated C code and include files. By clicking these links, you can examine the generated code and interpret the Code Execution Profile Report.

2. Start the real-time application, then start the profiler.
startProfiler(tg);
start(tg);
pause(5);
stopProfiler(tg);
stop(tg);
3. Display the profiler data.
while 1
    tmp = strcmp(tg.ProfilerStatus,'DataAvailable');
    if tmp == true
        break
    end
end
profiler_data = getProfilerData(tg);
plot(profiler_data);
report(profiler_data);
Processing data on target computer ...
Transferring data from target computer ...
Processing data on host computer ...
The Execution Profile schedule display in the Simulation Data Inspector shows how scheduling is generated in real-time simulation. To open the schedule display in the Simulation Data Inspector after creating the executionProfile object, use the executionProfile.schedule() function.

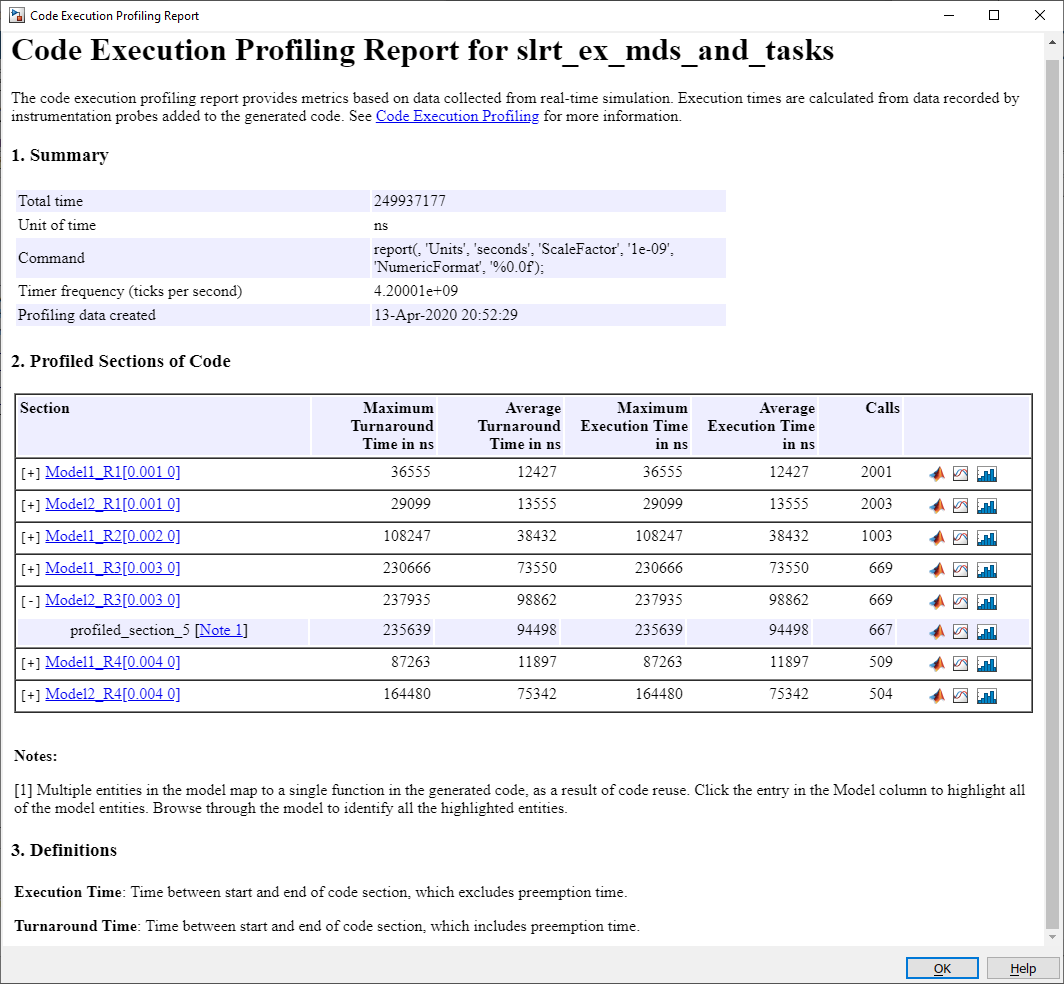
The Code Execution Profiling Report displays model execution profile results for each task.
To display the profile data for a section of the model, in the Section column, click the Membrane button next to the task.
To display the TET data for the section in Simulation Data Inspector, click the Plot time series data button.
To view the section in Simulink Editor, click the link next to the Expand Tree button.
To view the lines of generated code corresponding to the section, click the Expand Tree button, and then click the View Source button.
See Also
schedule (Embedded Coder) | report | plot | ProfilerData | stopProfiler | startProfiler | resetProfiler | getProfilerData | getAvailableProfile | deleteProfilerData
Related Topics
You can also select a web site from the following list:
Americas
- América Latina (Español)
- Canada (English)
- United States (English)
Europe
- Belgium (English)
- Denmark (English)
- Deutschland (Deutsch)
- España (Español)
- Finland (English)
- France (Français)
- Ireland (English)
- Italia (Italiano)
- Luxembourg (English)
- Netherlands (English)
- Norway (English)
- Österreich (Deutsch)
- Portugal (English)
- Sweden (English)
- Switzerland
- United Kingdom (English)