5G NR CSI-RS Measurements
This example shows the measurement procedure of CSI-RSRP, CSI-RSSI, and CSI-RSRQ for the test environment, as described in TS 38.133 Annex A.4.6.4.3, by using the channel state information reference signal from 5G Toolbox™.
Introduction
In NR 5G, the three types of CSI-RS based reference signal measurements, as defined in TS 38.215 Sections 5.1.2 and 5.1.4, includes:
CSI-RSRP (CSI reference signal received power): CSI-RSRP is defined as the linear average over the power contributions of the resource elements of the antenna ports, which carry CSI-RS configured for RSRP measurements. This measurement is performed across N number of resource blocks (measurement bandwidth). For this measurement, CSI-RS transmitted on antenna port(s) 3000 or 3000 and 3001 is used.
CSI-RSSI (CSI received signal strength indicator): CSI-RSSI is defined as the linear average of the total received power observed only in the OFDM symbols, in which CSI-RS is present. This measurement is also performed across N number of resource blocks (measurement bandwidth). CSI-RSSI includes the power from sources, such as co-channel serving and non-serving cells, adjacent channel interference, and thermal noise. For this measurement, CSI-RS transmitted on antenna port 3000 is used.
CSI-RSRQ (CSI reference signal received quality): CSI-RSRQ is defined as, .
The purposes of these measurements include:
Cell selection and reselection
Mobility and handover management
Beam management (beam adjustment and beam recovery)
This example configures only the CSI-RS from the test environment.
Initialize Configuration Objects
Carrier configuration
Create carrier configuration object occupying 10 MHz bandwidth with 15 kHz subcarrier spacing as per configuration 1 in TS 38.133 Table A.4.6.4.3.1-1.
carrier = nrCarrierConfig;
carrier.NSlot = 1;
carrier.NSizeGrid = 52;
CSI-RS configuration
As per the test environment TS 38.133 Table A.4.6.4.3.2-1, user equipment (UE) is configured with one CSI-RS resource set (CSI-RS 1.2 FDD), consisting of 2 CSI-RS resources.
csirs = nrCSIRSConfig;
% CSI-RS resource             #0       #1
csirs.CSIRSType           = {'nzp',   'nzp'};
csirs.CSIRSPeriod         = {[10 1],  [10 1]};
csirs.RowNumber           = [1        1]; % Single port (3000) CSI-RS resources
csirs.Density             = {'three', 'three'};
csirs.SymbolLocations     = {6,       10};
csirs.SubcarrierLocations = {0,       0};
csirs.NumRB               = [52,      52]; % Measurement bandwidth in terms of number of resource blocks
Generate CSI-RS Symbols and Indices
Generate CSI-RS symbols and indices for the specified carrier and CSI-RS configuration parameters with the output resource format as 'cell'. This output resource format provides a way to identify the outputs uniquely for each CSI-RS resource in a resource set. You can also apply different power levels to each CSI-RS resource.
ind = nrCSIRSIndices(carrier,csirs,'OutputResourceFormat','cell');
sym = nrCSIRS(carrier,csirs,'OutputResourceFormat','cell');
Signal and Noise Power Setup
Set up the signal and noise powers as described in TS 38.133 Table A.4.6.4.3.2-2. As per note 2 in TS 38.133 Table A.4.6.4.3.2-2, interference from other cells and noise from other sources is modeled as additive white Gaussian noise (AWGN) of appropriate power Noc.
SINRdB0 = 0; % For CSI-RS #0
SINRdB1 = 3; % For CSI-RS #1
NocdBm = -94.65;
NocdB = NocdBm - 30;
Noc = 10^(NocdB/10);
Calculate the power scaling of CSI-RS resources by using SINR values.
% Power scaling of CSI-RS resource #0
SINR0 = 10^(SINRdB0/10);     % linear Es/Noc
Es0 = SINR0*Noc;

% Power scaling of CSI-RS resource #1
SINR1 = 10^(SINRdB1/10);     % linear Es/Noc
Es1 = SINR1*Noc;
Initialize the Carrier Resource Grid and Map CSI-RS Symbols to the Grid
Initialize the carrier resource grid for one slot.
ports = max(csirs.NumCSIRSPorts); % Number of antenna ports
txGrid = nrResourceGrid(carrier,ports);
Apply the power scaling values to the CSI-RS resources and map them onto the grid.
txGrid(ind{1}) = sqrt(Es0)*sym{1};
txGrid(ind{2}) = sqrt(Es1)*sym{2};

% Plot the carrier grid for two CSI-RS resources
plotGrid(size(txGrid),ind)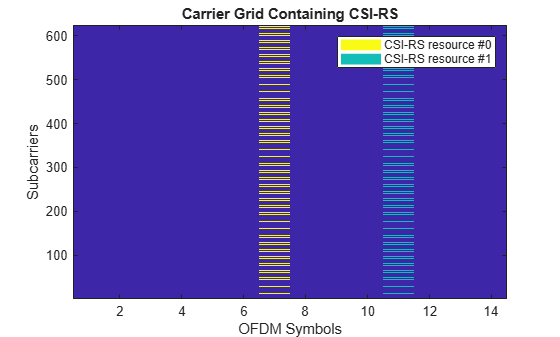
Perform OFDM Modulation
Perform OFDM modulation to generate the time-domain waveform.
[txWaveform,ofdmInfo] = nrOFDMModulate(carrier,txGrid);
Add AWGN to the Transmitted Waveform and Perform OFDM Demodulation
Consider the propagation condition as AWGN, as specified in TS 38.133 Table A.4.6.4.3.2-1.
% Generate the noise
rng('default');  % Set RNG state for repeatability
N0 = sqrt(Noc/(2*double(ofdmInfo.Nfft)));
noise = N0*complex(randn(size(txWaveform)),randn(size(txWaveform)));

% Add AWGN to the transmitted waveform
rxWaveform = txWaveform + noise;
Perform OFDM demodulation on the received time-domain waveform to get the received resource element array.
rxGrid = nrOFDMDemodulate(carrier,rxWaveform);
Perform CSI-RSRP, CSI-RSSI, and CSI-RSRQ Measurements
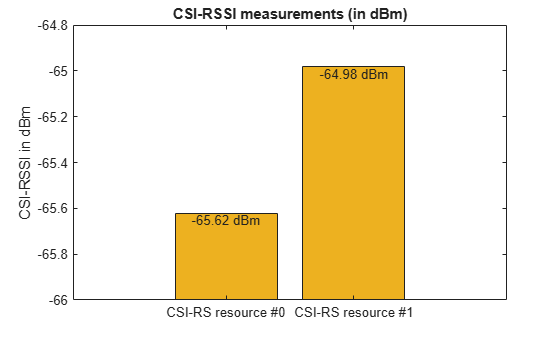
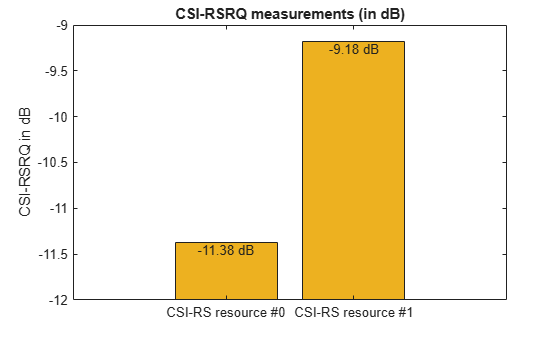
Finally, perform the CSI-RSRP, CSI-RSSI, and CSI-RSRQ measurements on the CSI-RS resources present in the received grid, by using the nrCSIRSMeasurements function*.*
meas = nrCSIRSMeasurements(carrier,csirs,rxGrid)
meas = struct with fields:
    RSRPPerAntenna: [-94.1599 -91.3258]
    RSSIPerAntenna: [-65.6220 -64.9823]
    RSRQPerAntenna: [-11.3779 -9.1834]
% Plot RSRPdBm, RSSIdBm and RSRQdB measurements for all CSI-RS resources
plotCSIRSMeasurements(meas)
You can compare the measured CSI-RSRP values of two CSI-RS resources represented by the output field RSRPdBm to the standard specified values given in TS 38.133 Table A.4.6.4.3.2-2.
Local Functions
function plotGrid(gridSize,csirsInd)
%    plotGrid(GRIDSIZE,CSIRSIND) plots the carrier grid of size GRIDSIZE
%    by populating the grid with CSI-RS symbols of multiple resources
%    indicated by a cell array of CSI-RS indices CSIRSIND.

    figure()
    cmap = colormap(gcf);

    % Considering the following values for two CSI-RS resources and they need
    % to be updated based on the number of CSI-RS resources
    names = {'CSI-RS resource #0','CSI-RS resource #1'};
    chpval = {20,2};
    chpscale = 0.25*length(cmap); % Scaling factor
    tempGrid = zeros(gridSize);
    tempGrid(csirsInd{1}) = chpval{1};
    tempGrid(csirsInd{2}) = chpval{2};

    image(chpscale*tempGrid(:,:,1)); % Multiplied with scaling factor for better visualization
    axis xy;
    clevels = chpscale*[chpval{:}];
    N = length(clevels);
    L = line(ones(N),ones(N),'LineWidth',8); % Generate lines
    % Index the color map and associate the selected colors with the lines
    set(L,{'color'},mat2cell(cmap( min(1+clevels,length(cmap) ),:),ones(1,N),3)); % Set the colors according to cmap
    % Create legend
    legend(names{:});

    title('Carrier Grid Containing CSI-RS')
    xlabel('OFDM Symbols');
    ylabel('Subcarriers');
end

function plotCSIRSMeasurements(meas)
%   plotCSIRSMeasurements(MEAS) plots CSI-RS based RSRP/RSSI/RSRQ measurements
    meas = structfun(@(s)max(s,[],1),meas,'UniformOutput',false);
    numRes = numel(meas.RSRPPerAntenna);
    xTickLabels = {};
    for idx = 1:numRes
        xTickLabels = [xTickLabels {['CSI-RS resource #' num2str(idx-1)]}]; %#ok<AGROW>
    end

    measType = {'CSI-RSRP','CSI-RSSI','CSI-RSRQ'};
    measVal = {meas.RSRPPerAntenna, meas.RSSIPerAntenna, meas.RSRQPerAntenna};
    measUnits = {'dBm','dBm','dB'};

    for measIdx = 1:3
        figure()
        values = measVal{measIdx};
        baseVal = 0;
        if ~any(values > 0)
            baseVal = floor(min(values));
        end
        b = bar(values,'FaceColor','#EDB120','BaseValue',baseVal);
        xticklabels(xTickLabels);

        xtips = b.XEndPoints;
        ytips = b.YEndPoints;
        for i = 1:numel(xtips)
            text(xtips(i), ytips(i), sprintf(['%0.2f ' measUnits{measIdx}],values(i)), ...
                'HorizontalAlignment', 'Center', 'VerticalAlignment', 'Top');
        end
        ylabel([measType{measIdx} ' in ' measUnits{measIdx}]);
        title([measType{measIdx} ' measurements (in ' measUnits{measIdx} ')'])
    end
end
References
[1] 3GPP TS 38.133. “NR; Requirements for support of radio resource management.” 3rd Generation Partnership Project; Technical Specification Group Radio Access Network.
[2] 3GPP TS 38.215. “NR; Physical layer measurements.” 3rd Generation Partnership Project; Technical Specification Group Radio Access Network.