New Support Package: Optical Design and Simulation Library for Image Processing Toolbox
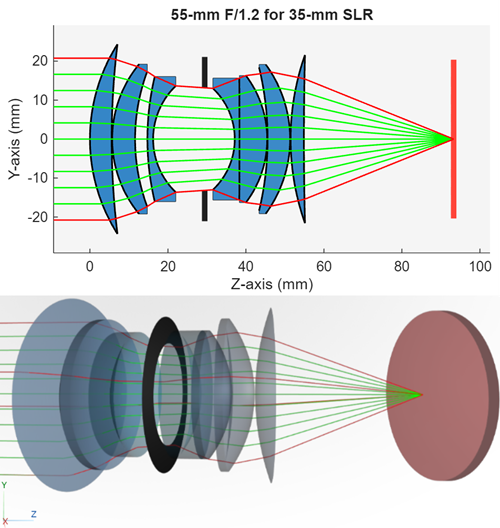
Design and simulate optical systems using the Optical Design and Simulation Library for Image Processing Toolbox™. The library enables you to:
Create and tune custom optical designs.
Import optical designs from ZMX files.
Visualize optical designs in 2-D and 3-D.
Evaluate optical system performance by tracing rays, computing spot diagrams, and performing aberration, lens distortion, field curvature, and polarization analysis.
Use bulk and coating materials from comprehensive material libraries, import bulk materials, and create custom optical materials and coatings.
Optimize optical systems and optical coatings using optimization tools available in Optimization Toolbox™.
The Optical System Designer app provides an interactive interface for optical system design. You can use the app to design custom optical systems, simulate imported optical systems from ZMX files, and interactively visualize traced rays, spot diagrams, aberrations, distortions, field curvature, and other analyses.
To get started with the Optical Design and Simulation Library for Image Processing Toolbox, see Get Started with Optical Design and Simulation.
You can install the Optical Design and Simulation Library for Image Processing Toolbox from the Add-On Explorer. For more information about installing add-ons, see Get and Manage Add-Ons.
Circle Detection: Detect circles using YOLOX deep learning model
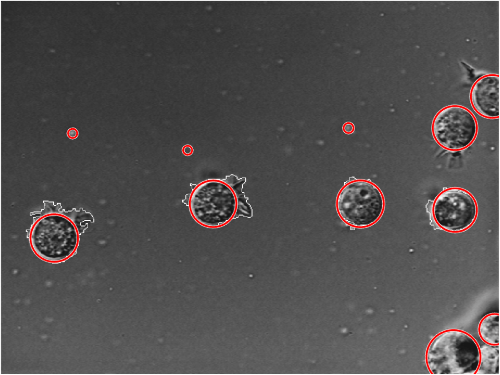
Identify circular objects of any size in images by using the imfindcirclesYOLO function. You can select a pretrained YOLOX model for
detecting the circles by using the Method name-value argument of
the function.
This function requires the Image Processing Toolbox Model for Circle Detection support package. You can install the support package from Add-On Explorer. For more information about installing add-ons, see Get and Manage Add-Ons.
SAM 2: Segment images using Segment Anything Model 2
Segment images using Segment Anything Model 2 (SAM 2) by specifying the model variant
using the new capabilities of the segmentAnythingModel object and imsegsam
function. To use SAM 2, you require the Image Processing Toolbox Model for Segment Anything Model
2 support package. You can install the support package from Add-On Explorer.
For more information about installing add-ons, see Get and Manage Add-Ons.
The default model for the segmentAnythingModel object and
imsegsam function is now "sam2-large".
To use any of the SAM 2 models, install the Image Processing Toolbox Model for Segment Anything Model
2 add-on.
Image Display: Label ROIs
Label scenes in a Viewer object using new ROI annotation objects. You
can create viewer-based ROIs three ways:
From the viewer toolbar, select the Draw annotations icon and select a shape to draw. Click in the scene and drag to draw the ROI. To export the ROI as an object, right-click the shape and select Export annotation to workspace.
Use the new uidraw function, which enables an interactive drawing mode in a
viewer you specify.
Use an object creation function, such as
images.ui.graphics.roi.Circle. To display the ROI, add
the object to the Annotations property of a
Viewer object.
This table summarizes the options for creating each ROI shape:
| Shape | Viewer Toolbar Support | uidraw Syntax | Object Creation Function |
|---|---|---|---|
Line (since R2024a) | 2-D and 3-D | uidraw(viewer,"line") | images.ui.graphics.roi.Line |
Point (since R2024a) | 2-D and 3-D | uidraw(viewer,"point") | images.ui.graphics.roi.Point |
| 2-D only | uidraw(viewer,"rectangle") | images.ui.graphics.roi.Rectangle | |
| 2-D only | uidraw(viewer,"circle") | images.ui.graphics.roi.Circle | |
| 2-D only | uidraw(viewer,"polygon") | images.ui.graphics.roi.Polygon | |
| 2-D only | uidraw(viewer,"angle") | images.ui.graphics.roi.Angle | |
| None | uidraw(viewer,"polyline") | images.ui.graphics.roi.Polyline | |
| None | uidraw(viewer,"freehand") | images.ui.graphics.roi.Freehand | |
| None | uidraw(viewer,"ellipse") | images.ui.graphics.roi.Ellipse |
To convert the ROI to a binary mask for additional processing and analysis, use the
createMask object function.
The Line and Point objects, originally introduced in R2024a, now
have the Visible, Interactions, and
Parent properties to specify their visibility, interactive
behavior, and parent object, respectively. The Line object also has
the Distance property, which indicates the distance between the
endpoints of the line.
Image Display: Draw masks using paintbrush
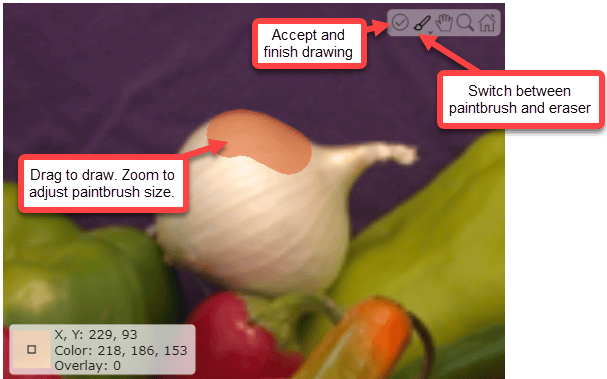
The new paintbrush tool supports drawing overlay masks on images displayed in a
Viewer object. Enable the paintbrush tool by using the uipaint function. After you draw the mask in the viewer window and
select the accept icon in the viewer toolbar, the function returns a binary mask you can
use for image processing and analysis.
Volume Display: Specify camera view and interactivity
Use a new function and several new Viewer Properties to customize the camera view and camera interactions.
Update the camera view by specifying azimuth and elevation angles using
the new viewangle function.
Control the behavior of rotation, zoom, and pan interactions by specifying
the new CameraInteractionStyle property. For example,
select a style that rotates the view about the pointer location instead of
the center of the volume, or that uses a dolly zoom to simulate a
first-person perspective.
View the scene using a perspective or orthographic camera by specifying
the new CameraProjection property.
Control the field of view by specifying the new
CameraViewAngle property.
Define the visible area in view of the camera by specifying the new
CameraViewport property.
linkviewers Function: Synchronize camera properties of multiple
viewers
Synchronize camera properties of multiple viewers using the new linkviewers function. You can synchronize camera properties such as
zoom, view angle, projection, and so on for seamless comparison.
Volume Viewer App: Updated toolstrip and enhanced rendering editor
The updated Volume Viewer app now:
Displays the voxel coordinates and intensity for a point, when you hover over it, in the bottom of the app window.
Provides horizontal scrollbars, which make it easier to navigate slice planes, and labels that indicate the current slice and total number of slices in that plane.
Supports new rendering styles in the Rendering Editor, including cinematic rendering, minimum intensity projection, gradient opacity, and slice planes.
Supports visualizing and adjusting the opacity of the volume and labels simultaneously by selecting the new View Volume and View Labels buttons.
Displays options for importing volume and label data in a single Import drop-down list.
regionprops Function: Get boundary coordinates of
regions
The regionprops function can now return the
coordinates of pixels on the exterior boundary of regions in a binary image. To return
the coordinates of boundary pixels, include "BoundaryCoordinates"
when specifying the properties input argument.
imresize3 Function: Resize color and multichannel
volumes
The imresize3 function can now resize color
and multichannel volumes.
dlresize Function: Map points from input space to output space
by aligning corners
The dlresize
function can now map points from input space to output space by aligning corners. To
align corners, specify the interpolation method Method as
"linear" and the GeometricTransformMode as
"aligned-corners".
affineOutputView Function: Specify spatial referencing
The affineOutputView function now accepts a spatial referencing object for
the input image. Use this argument when your input image is not in the intrinsic
coordinate system.
dicomCollection Function: Specify list of filenames
The dicomCollection function now accepts a list of DICOM filenames specified
as a vector of strings as the input source.
DICOM Files: Read and write DICOM metadata with minimal preprocessing
The dicominfo function now supports reading
certain metadata strings with minimal preprocessing using the new
PreserveStrings argument. When you specify
PreserveStrings as true, the
dicominfo function reads attributes with Person Name (PN),
Decimal String (DS), and Integer String (IS) value representations as character vectors,
preserving their original format. Reading these attributes as character vectors can
simplify searching for patient information, and preserves the precision of numeric
strings. By default, dicominfo continues to convert PN attributes
to structures with fields for each part of the patient name, and DS and IS attributes to
numeric values.
When you create a new DICOM file using the dicomwrite and dicomanon functions, you can provide metadata that specifies PN
attributes as structures or character vectors, and DS and IS attributes as numeric
values or character vectors. Specify character vectors when you want to preserve the
precision of DS and IS values from the original file.
DICOM Browser App: Export volumes to Medical Volume Viewer or Medical Image Labeler
The DICOM Browser app now supports exporting volume series to the Medical Volume Viewer and Medical Image Labeler apps, which apply file metadata to display volumes using the correct voxel spacing and patient orientation, and with anatomical display markers. You can also export 2-D images and image series to the Medical Image Labeler app. The new export options require a Medical Imaging Toolbox™ license.
Hyperspectral Image Processing: Hyperspectral Imaging Library for Image Processing Toolbox (Version 26.1)
Label regions of interest (ROI) in hyperspectral and multispectral images by using the Spectral Image Labeler app. The app reads images stored in files or from the workspace. Using the app, you can:
Choose false color, RGB, CIR, or custom views of spectral images for ease of labeling.
Create multiple label definitions and label ROIs using built-in automatic and manual techniques.
Write, import, and use your own custom automation algorithm to automatically label ground truth data.
Export the labeled ground truth data as a groundTruthSpectralImage object. You can use this
object to share labels with colleagues or to store ground truth
labels for pixel classification or semantic segmentation.
Manage labeled ground truth data for pixel classification and semantic
segmentation applications using the groundTruthSpectralImage object and its functions.
Export a ground truth object from the Spectral Image Labeler app or create one programmatically at the command line.
Load existing ground truth data and labels into the
Spectral Image Labeler app from
groundTruthSpectralImage objects.
R2026a includes these new examples:
To use these functions and tools, you must download the Hyperspectral Imaging Library for Image Processing Toolbox from the Add-On Explorer. For more information, see Get and Manage Add-Ons.
The hypercube function will be removed in a future
release. To create a hypercube object, use the imhypercube or geohypercube functions instead.
The hypercube object no longer has the
DataCube property.
You can no longer read multispectral data using the
hypercube object. Use the multicube object to read multispectral data.
C Code Generation: Generate code from additional functions using MATLAB Coder
This list indicates the Image Processing Toolbox functions that have been enabled for code generation in this release. For all target platforms, these functions generate C code. For a complete list of Image Processing Toolbox functions that support code generation, see Functions Supporting Code Generation.
GPU Code Generation Support for resize3dLayer Function
The resize3dLayer function has been enabled for optimized CUDA® code generation in this release.
Functionality being removed or changed
bigimage and bigimageDatastore have been
removed
Errors
The bigimage object and the bigimageDatastore
object have been removed. To read and process large or multiresolution images, use
the blockedImage object and the blockedImageDatastore object instead.
imshow Function: Live Editor always uses initial
magnification value "fit"
Behavior change
When you use the imshow function in the Live Editor,
the default InitialMagnification value is now
"fit". Previously, the default value was
100, and titles could appear cropped.
You do not need to update your code. If you specify the
InitialMagnification value in a live script, the function
ignores it without error. However, the size of images may differ from previous
releases.
bwskel Function: Behavior changes resulting from
improvements to 2-D skeletonization algorithm
Behavior change
The bwskel function now implements an improved skeletonization algorithm
for 2-D images. The new algorithm returns more symmetric and realistic skeletons.
The results can differ from prior releases.
Parent-child dependencies returned as sparse matrix in code generation for
bwboundaries
Behavior change
The bwboundaries function now returns
parent-child dependencies A as a sparse matrix in C/C++ and GPU
code generation, instead of returning a full matrix as in previous releases.