LTE Downlink Adjacent Channel Leakage Power Ratio (ACLR) Measurement
This example shows how the Adjacent Channel Leakage Power Ratio (ACLR) can be measured within a downlink Reference Measurement Channel (RMC) signal using the LTE Toolbox™.
Introduction
This example performs Adjacent Channel Leakage power Ratio (ACLR) measurements according to TS36.104, Section 6.6.2 [ 1 ] for a downlink waveform. ACLR is used as a measure of the amount of power leaking into adjacent channels and is defined as the ratio of the filtered mean power centered on the assigned channel frequency to the filtered mean power centered on an adjacent channel frequency. Minimum ACLR conformance requirements are given for E-UTRA (LTE) carriers and UTRA (W-CDMA) carriers.
The example is structured as follows:
A downlink waveform is generated using a Reference Measurement Channel (RMC) configuration
Parameters for ACLR measurements are calculated including the required oversampling rate to ensure a signal capable of representing both the E-UTRA and UTRA 1st and 2nd adjacent carriers with at most 85% bandwidth occupancy
The waveform is oversampled as required
The E-UTRA ACLR is calculated using a square measurement filter
The UTRA ACLR is calculated using a Root Raise Cosine (RRC) filter
The ACLR measurements are displayed
Waveform Generation
A downlink RMC is used for measuring ACLR and created using lteRMCDL and lteRMCDLTool.
% Generate the downlink configuration structure for RMC R.6
cfg = lteRMCDL('R.6');

% Generate the waveform which is a T-by-P matrix where T is the number of
% time-domain samples and P is the number of receive antennas
[waveform, ~, info] = lteRMCDLTool(cfg, [1; 0; 0; 1]);

% Write the sampling rate and chip rate to the configuration structure to
% allow the calculation of ACLR parameters
cfg.SamplingRate = info.SamplingRate;
cfg.UTRAChipRate = 3.84;              % UTRA chip rate in MCPS
Calculate ACLR Parameters
The parameters required for ACLR measurement are calculated using the helper function hACLRParameters.m.
Determine Required Oversampling. If the input waveform sampling rate (
cfg.SamplingRate) is not sufficient to span the entire bandwidth (aclr.BandwidthACLR) of the adjacent channels (allowing for a maximum of 85% bandwidth occupancy), an upsampled version of the waveform must be used for ACLR calculations.aclr.OSRis the upsampling factor.Determine UTRA Parameters; the chip rates and bandwidths.
% Calculate ACLR measurement parameters
[aclr, nRC, R_C, BWUTRA] = hACLRParameters(cfg);
Perform Filtering of the Waveform to Improve ACLR
The waveform generated above has no filtering, so there are significant out of band spectral emissions owing to the implicit rectangular pulse shaping in the OFDM modulation (each OFDM subcarrier has a sinc shape in the frequency domain). In order to achieve a good ACLR performance, filtering must be applied to the waveform. A filter is designed with a transition band that starts at the edge of the occupied transmission bandwidth (aclr.BandwidthConfig) and stops at the edge of the overall channel bandwidth (aclr.Bandwidth). This filter involves no rate change, it just shapes the spectrum within the original bandwidth of the waveform. The filter is first designed, then applied to the waveform.
% Design filter
firFilter = dsp.LowpassFilter();
firFilter.SampleRate = info.SamplingRate;
firFilter.PassbandFrequency = aclr.BandwidthConfig/2;
firFilter.StopbandFrequency = aclr.Bandwidth/2;

% Apply filter
waveform = firFilter(waveform);
Calculate E-UTRA and UTRA ACLR
The ACLR for E-UTRA and UTRA is measured using two helper functions:
hACLRMeasurementEUTRA.m measures the E-UTRA ACLR using a square window on adjacent channels. A DFT of the measurement signal is taken and the energy of the appropriate bins used to calculate the adjacent channel powers.
hACLRMeasurementUTRA.m measures the UTRA ACLR using a RRC filter on adjacent channels with a roll-off factor of 0.22 and bandwidth equal to the chip rate.
% Apply required oversampling
resampled = resample(waveform,aclr.OSR,1);

% Calculate E-UTRA ACLR
aclr = hACLRMeasurementEUTRA(aclr, resampled);

% Calculate UTRA ACLR
aclr = hACLRMeasurementUTRA(aclr, resampled, nRC, R_C, BWUTRA);
Display Results
The ACLR results are returned in structure aclr. aclr contains the fields:
Bandwidth: The channel bandwidth associated withcfg.NDLRBorcfg.NULRB, in Hertz. This is the overall bandwidth of the assigned channel.BandwidthConfig: The transmission bandwidth configuration associated withcfg.NDLRBorcfg.NULRB, in Hertz. This is the bandwidth within the channel bandwidth that contains active subcarriers.BandwidthACLR: The bandwidth required to represent both the E-UTRA and UTRA 1st and 2nd adjacent carriers; the sampling rate used internally for ACLR measurements will support this bandwidth with at most 85% bandwidth occupancy.OSR: The integer oversampling ratio of the inputwaveformrequired to create a signal capable of representing both the E-UTRA and UTRA 1st and 2nd adjacent carriers i.e. to representaclr.BandwidthACLRwith at most 85% bandwidth occupancy.SamplingRate: The sampling rate of the internal measurement signal from which the ACLR is calculated. IfOSR=1, this signal is the input waveform; ifOSR>1, this signal is the input waveform upsampled byOSR. Therefore:aclr.SamplingRate = OSR*cfg.SamplingRate.EUTRAPowerdBm: The power, in decibels relative to 1mW in 1ohm, of the input within the E-UTRA channel of interest i.e. in a square filter of bandwidthaclr.BandwidthConfigcentered at 0Hz.EUTRAdB: A vector of E-UTRA ACLRs, in decibels relative toaclr.EUTRAPowerdBm, measured for adjacent channels [-2, -1, 1, 2].EUTRACenterFreq: A vector of E-UTRA center frequencies, in Hertz, for adjacent channels [-2, -1, 1, 2].UTRAPowerdBm: A vector of powers, in decibels relative to 1mW in 1ohm, of the input within the UTRA channel of interest; each element of the vector corresponds to each of the configured UTRA chip rates i.e.UTRAPowerdBm(i)gives the power of the input in an RRC filter designed forR=cfg.UTRAChipRate(i)Mchips/s,alpha=0.22, centered at 0 Hz.UTRAdB: A matrix of UTRA ACLRs, in decibels relative toaclr.EUTRAPowerdBm. The columns give the values for adjacent channels [-2, -1, 1, 2] and the rows give the values for each of the configured UTRA chip rates. Note that as required by the standard, these ACLRs are relative toaclr.EUTRAPowerdBm, notaclr.UTRAPowerdBm.UTRACenterFreq: A matrix of UTRA center frequencies, in Hertz. The columns give the values for adjacent channels [-2, -1, 1, 2] and the rows give the values for each of the configured UTRA chip rates.
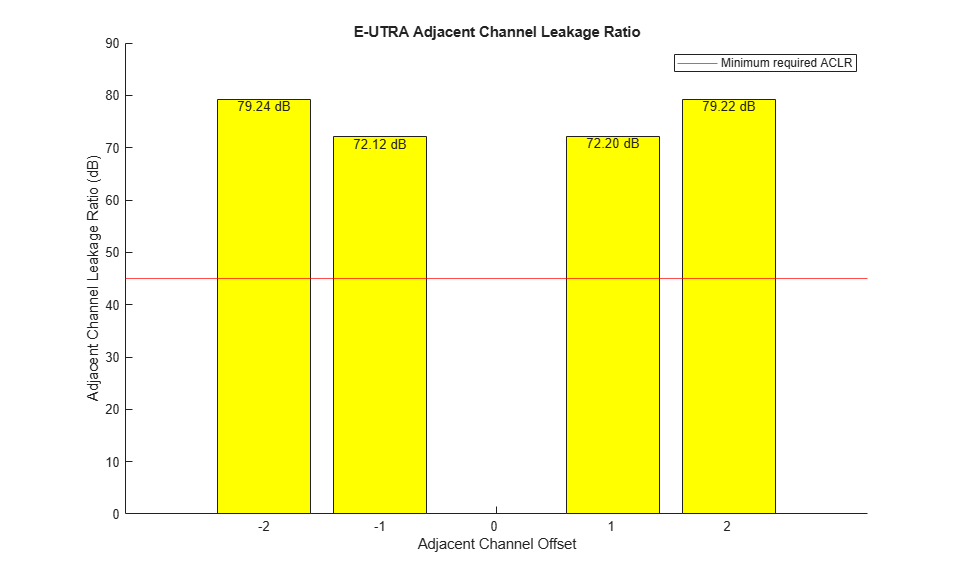
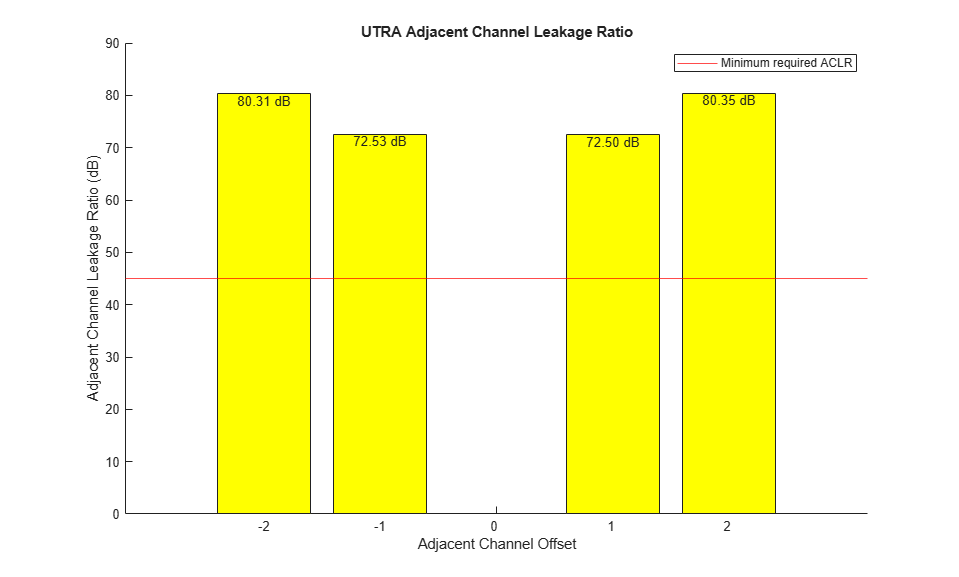
hACLRResults.m displays the ACLR and plots the adjacent channel powers. According to TS 36.104 Table 6.6.2.1-1 [ 1 ], the minimum required ACLR for a Base Station in paired spectrum is 45 dB. As the ACLR results are higher than 45 dB, they fall within the requirements.
minACLR = 45;
hACLRResults(aclr,minACLR);
          Bandwidth: 5000000
    BandwidthConfig: 4500000
      BandwidthACLR: 25000000
                OSR: 4
       SamplingRate: 30720000
    EUTRACenterFreq: [-10000000 -5000000 5000000 10000000]
      EUTRAPowerdBm: -0.5918
            EUTRAdB: [79.2363 72.1188 72.2047 79.2161]
       UTRAPowerdBm: -1.3397
             UTRAdB: [80.3118 72.5324 72.5012 80.3541]
     UTRACenterFreq: [-10000000 -5000000 5000000 10000000]
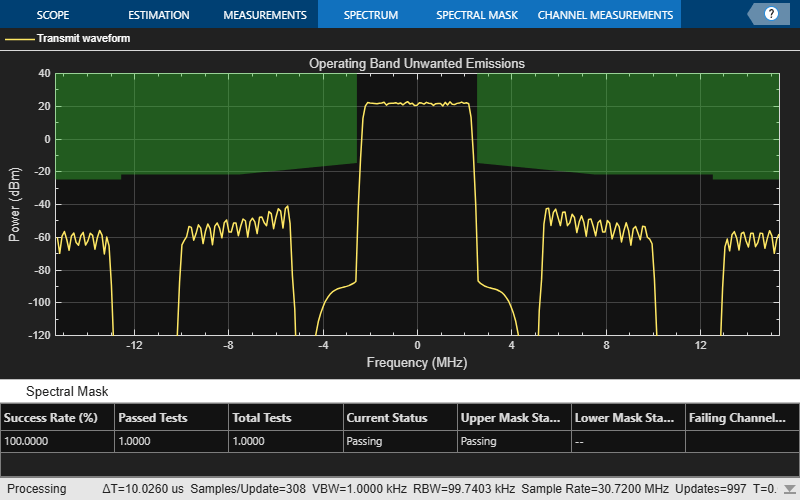
Operating Band Unwanted Emissions (Spectral Mask)
The waveform spectrum is displayed in conjunction with the transmit spectral mask defined in TS 36.104. This example assumes that the waveform corresponds to a Medium Range BS as described in TS 36.104 Table 6.2-1 and the power is set to 38.0dBm (~21.5dBm/100kHz). The corresponding spectral mask is provided in TS 36.104 Table 6.6.3.2C-5 "Medium Range BS operating band unwanted emission limits for 5, 10, 15 and 20MHz channel bandwidth, 31 < P_max,c <= 38dBm".
% Adjust waveform power to maximum rated output power
P_max = 38.0; % TS 36.104 Table 6.2-1
bsWaveform = resampled * 10^((P_max-aclr.EUTRAPowerdBm)/20);

% Create a spectrum analyzer, configure it for the waveform sampling rate
% and a resolution bandwidth of 100kHz, configure and display the spectral
% mask in TS 36.104 Table 6.6.3.2C-5, and perform spectrum analysis of the
% waveform
rbw = 100e3; % resolution bandwidth
vbw = 1e3;  % video bandwidth
spectrumScope = spectrumAnalyzer;
spectrumScope.Name = 'Operating Band Unwanted Emissions';
spectrumScope.Title = spectrumScope.Name;
spectrumScope.SampleRate = info.SamplingRate * aclr.OSR;
spectrumScope.RBWSource = 'property';
spectrumScope.RBW = rbw;
spectrumScope.AveragingMethod = 'vbw';
spectrumScope.VBWSource = 'property';
spectrumScope.VBW = vbw;
spectrumScope.ShowLegend = true;
spectrumScope.ChannelNames = {'Transmit waveform'};
spectrumScope.YLimits = [-120 40];

% "Frequency offset of measurement filter center frequency" in table
f_offset = [0.05; 5.05; 10.05; 10.05] * 1e6;

% "Minimum requirement" in table (dBm/100kHz)
mask_power = [(P_max-53); (P_max-60)*[1; 1]; min(P_max-60,-25)*[1; 1];];
% Add vertical mask segment at the band edge; no particular in-band power
% mask is required to be met for this test
f_offset = [repmat(f_offset(1),2,1); f_offset];
mask_power = [spectrumScope.YLimits(2)*[1; 1]; mask_power];

% Extend mask to analysis bandwidth edge, assumed to be closer to the edge
% frequency of the carrier of interest than f_offset_max (the offset to the
% frequency 10MHz outside the downlink operating band)
mask_freq = [f_offset + aclr.Bandwidth/2; spectrumScope.SampleRate/2];

% Add a mirrored version of the mask to cover negative frequencies, and
% enable the mask
mask_power = [flipud(mask_power); mask_power];
mask_freq = [-flipud(mask_freq); (mask_freq)];
spectrumScope.SpectralMask.EnabledMasks = 'Upper';
spectrumScope.SpectralMask.UpperMask = [mask_freq, mask_power];

% Perform spectrum analysis
spectrumScope(bsWaveform);
Perform Downsampling and Measure EVM
Finally the waveform is downsampled and resynchronized and an EVM measurement is performed. For more information on making EVM measurements, see PDSCH Error Vector Magnitude (EVM) Measurement. According to TS 36.104 Table 6.5.2-1 [ 1 ], the maximum EVM when the constellation is 64QAM is 8%. As the overall EVM, around 0.78%, is lower than 8%, this measurement falls within the requirements.
downsampled = resample(resampled,1,aclr.OSR);
offset = lteDLFrameOffset(cfg,downsampled,'TestEVM');
cec.PilotAverage = 'TestEVM';
evmsettings.EnablePlotting = 'Off';
evm = hPDSCHEVM(cfg,cec,downsampled(1+offset:end,:),evmsettings);
Low edge EVM, subframe 0: 0.698%
High edge EVM, subframe 0: 0.723%
Low edge EVM, subframe 1: 0.835%
High edge EVM, subframe 1: 0.803%
Low edge EVM, subframe 2: 0.772%
High edge EVM, subframe 2: 0.714%
Low edge EVM, subframe 3: 0.657%
High edge EVM, subframe 3: 0.683%
Low edge EVM, subframe 4: 0.824%
High edge EVM, subframe 4: 0.658%
Low edge EVM, subframe 6: 0.791%
High edge EVM, subframe 6: 0.763%
Low edge EVM, subframe 7: 0.751%
High edge EVM, subframe 7: 0.711%
Low edge EVM, subframe 8: 0.738%
High edge EVM, subframe 8: 0.758%
Averaged overall EVM: 0.761%
Further Exploration
You can modify parts of this example to calculate ACLR (as per TS36.101, Section 6.6.2.3 [ 2 ]) for the uplink by using lteRMCUL in the place of lteRMCDL to generate the waveform.
Selected Bibliography
3GPP TS 36.104 "Base Station (BS) radio transmission and reception"
3GPP TS 36.101 "User Equipment (UE) radio transmission and reception"