Specify Plot Colors
MATLAB® creates plots using a default set of colors. The default colors provide a
clean and consistent look across the different plots you create. You can customize the
colors if you need to. Many plotting functions have an input argument such as
c or colorspec for customizing the color. The
objects returned by these functions typically have properties for controlling the color.
The names of the arguments and properties can vary, but the values they accept typically
follow a common pattern. Once you are familiar with the pattern, you can use it to
modify a wide variety of plots.
The following examples use the bar and
scatter functions to demonstrate the overall approach for
customizing colors. For a complete list of valid color values for a specific plotting
function, refer to the documentation for that function.
Types of Color Values
There are these types of color values:
Color Name or Short Name — Specify the name of a color such as
"red"or"green". Short names specify a letter from a color name, such as"r"or"g".RGB Triplet — Create a custom color by specifying a three-element row vector whose elements are the intensities of the red, green, and blue components of a color. The intensities must be in the range
[0,1]. For example, you can specify a shade of pink as[1 0.5 0.8].Some function arguments that control color do not accept RGB triplets, but object properties that control color typically do.
Hexadecimal Color Code — Create a custom color by specifying a string or a character vector that starts with a hash symbol (
#) followed by three or six hexadecimal digits, which can range from0toF. The values are not case sensitive. Thus, the color codes"#FF8800","#ff8800","#F80", and"#f80"all specify the same shade of orange.Some function arguments that control color do not accept hexadecimal color codes, but you can specify a hexadecimal color code using a name-value argument that corresponds to an object property. For example,
scatter(x,y,sz,"MarkerFaceColor","#FF8800")sets the marker color in a scatter plot to orange.
This table lists all of the valid color names and short names with the corresponding RGB triplets and hexadecimal color codes.
| Color Name | Short Name | RGB Triplet | Hexadecimal Color Code | Appearance |
|---|---|---|---|---|
"red" | "r" | [1 0 0] | "#FF0000" |
|
"green" | "g" | [0 1 0] | "#00FF00" |
|
"blue" | "b" | [0 0 1] | "#0000FF" |
|
"cyan"
| "c" | [0 1 1] | "#00FFFF" |
|
"magenta" | "m" | [1 0 1] | "#FF00FF" |
|
"yellow" | "y" | [1 1 0] | "#FFFF00" |
|
"black" | "k" | [0 0 0] | "#000000" |
|
"white" | "w" | [1 1 1] | "#FFFFFF" |
|
Here are the RGB triplets and hexadecimal color codes for the default colors MATLAB uses in many types of plots. These colors do not have names associated with them.
| RGB Triplet | Hexadecimal Color Code | Appearance |
|---|---|---|
[0 0.4470 0.7410] | "#0072BD" |
|
[0.8500 0.3250 0.0980] | "#D95319" |
|
[0.9290 0.6940 0.1250] | "#EDB120" |
|
[0.4940 0.1840 0.5560] | "#7E2F8E" |
|
[0.4660 0.6740 0.1880] | "#77AC30" |
|
[0.3010 0.7450 0.9330] | "#4DBEEE" |
|
[0.6350 0.0780 0.1840] | "#A2142F" |
|
Specify Color of a Bar Chart
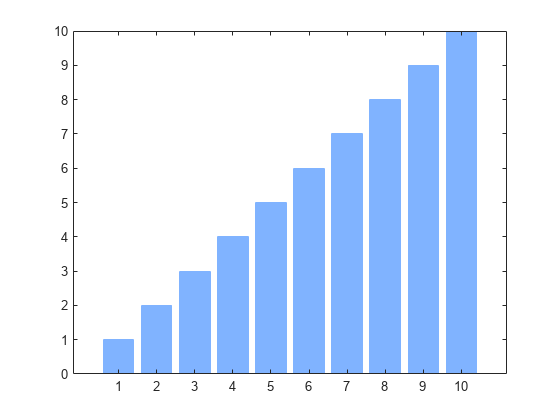
Create a red bar chart by calling the bar function and specifying the optional color argument as "red". Return the bar object as b, so you can customize other aspects of the chart later.
b = bar(1:10,"red");
Now, change the bar fill color and outline color to light blue by setting the FaceColor and EdgeColor properties to the hexadecimal color code,"#80B3FF".
Before R2019a, specify an RGB triplet instead of a hexadecimal color code. For example, b.FaceColor = [0.5 0.7 1].
b.FaceColor = "#80B3FF";
b.EdgeColor = "#80B3FF";
Specify Marker Colors in a Scatter Plot
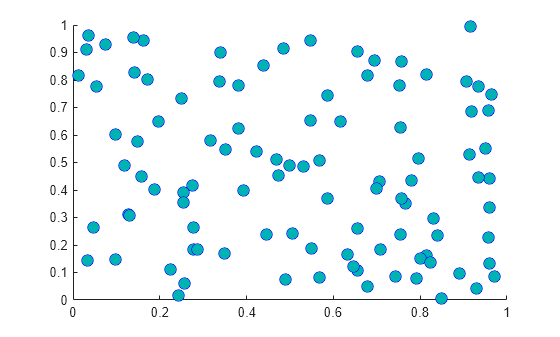
Create a scatter plot of random numbers. Specify the marker size as 75 points, and use name-value arguments to specify the marker outline and fill colors. The MarkerEdgeColor property controls the outline color, and the MarkerFaceColor controls the fill color.
x = rand(1,100);
y = rand(1,100);
scatter(x,y,75,"MarkerEdgeColor","b", ...
    "MarkerFaceColor",[0 0.7 0.7])
Specify Colors in a Series of Plots
There are two ways to create a series of plots:
Call a plotting function multiple times and use the
holdfunction to retain the contents of the axes.Pass a matrix containing multiple data series to the plotting function. The
plotfunction has always accepted matrix inputs, and many other plotting functions also support matrix inputs.
To specify colors with either approach, call the desired plotting function with an output argument so you can access the individual plot objects. Then set properties on the plot object you want to change.
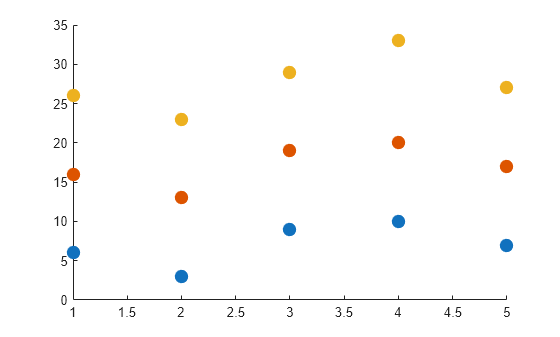
For example, create a scatter plot with 100-point filled markers. Call the scatter function with an output argument s1. Call the hold function to retain the contents of the axes, and then call the scatter function two more times with output arguments s2 and s3. The variables s1, s2, and s3 are Scatter objects.
figure
x = 1:5;
s1 = scatter(x,[6 3 9 10 7],100,"filled");
hold on
s2 = scatter(x,[16 13 19 20 17],100,"filled");
s3 = scatter(x,[26 23 29 33 27],100,"filled");
hold off
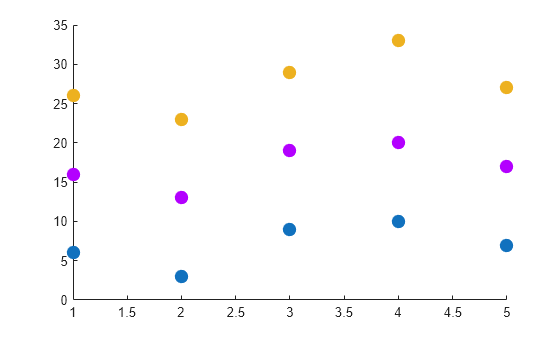
Change the color of the second Scatter object to a shade of purple.
s2.MarkerFaceColor = [0.7 0 1];
The scatter function also supports matrix inputs (since R2021a), so you can create the same plot by passing a matrix and returning a vector of objects.
figure
x = 1:5;
y = [6 3 9 10 7; 16 13 19 20 17; 26 23 29 33 27];
s = scatter(x,y,100,"filled");
To change the color of the second data series in this case, access the second Scatter object by indexing into s.
s(2).MarkerFaceColor = [0.7 0 1];

See Also
Functions
scatter|bar|validatecolor
Properties
Related Topics
You can also select a web site from the following list:
Americas
- América Latina (Español)
- Canada (English)
- United States (English)
Europe
- Belgium (English)
- Denmark (English)
- Deutschland (Deutsch)
- España (Español)
- Finland (English)
- France (Français)
- Ireland (English)
- Italia (Italiano)
- Luxembourg (English)
- Netherlands (English)
- Norway (English)
- Österreich (Deutsch)
- Portugal (English)
- Sweden (English)
- Switzerland
- United Kingdom (English)