Create 2-D Line Plot
Create a simple line plot and label the axes. Customize the appearance of plotted lines by changing the line color, the line style, and adding markers.
Create Line Plot
Create a two-dimensional line plot using the plot function. For example, plot the value of the sine function from 0 to .
x = linspace(0,2*pi,100);
y = sin(x);
plot(x,y)
Label the axes and add a title.
xlabel('x')
ylabel('sin(x)')
title('Plot of the Sine Function')

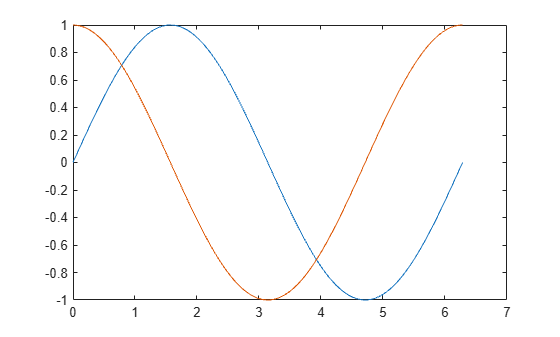
Plot Multiple Lines
By default, MATLAB clears the figure before each plotting command. Use the figure command to open a new figure window. You can plot multiple lines using the hold on command. Until you use hold off or close the window, all plots appear in the current figure window.
figure
x = linspace(0,2*pi,100);
y = sin(x);
plot(x,y)

hold on
y2 = cos(x);
plot(x,y2)
hold off
Change Line Appearance
You can change the line color, line style, or add markers by including an optional line specification when calling the plot function. For example:
':'plots a dotted line.'g:'plots a green, dotted line.'g:*'plots a green, dotted line with star markers.'*'plots star markers with no line.
The symbols can appear in any order. You do not need to specify all three characteristics (line color, style, and marker). For more information about the different style options, see the plot function page.
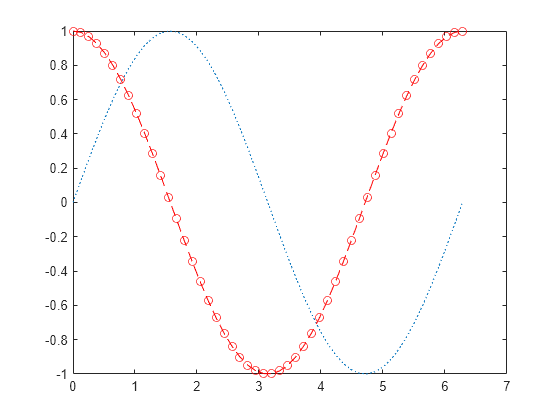
For example, plot a dotted line. Add a second plot that uses a dashed, red line with circle markers.
x = linspace(0,2*pi,50);
y = sin(x);
plot(x,y,':')

hold on
y2 = cos(x);
plot(x,y2,'--ro')
hold off
Plot only the data points by omitting the line style option from the line specification.
x = linspace(0,2*pi,25);
y = sin(x);
plot(x,y,'o')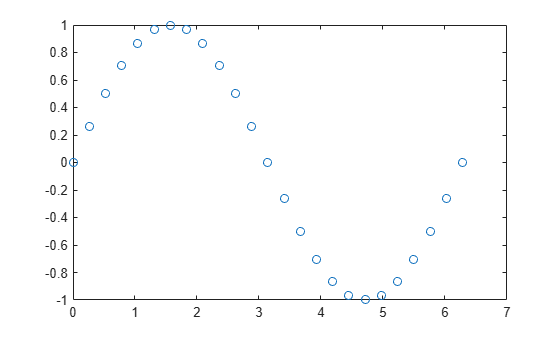
Change Line Object Properties
You also can customize the appearance of the plot by changing properties of the Line object used to create the plot.
Create a line plot. Assign the Line object created to the variable ln. The display shows commonly used properties, such as Color, LineStyle, and LineWidth.
x = linspace(0,2*pi,25);
y = sin(x);
ln = plot(x,y)
ln =
  Line with properties:

              Color: [0.0660 0.4430 0.7450]
          LineStyle: '-'
          LineWidth: 0.5000
             Marker: 'none'
         MarkerSize: 6
    MarkerFaceColor: 'none'
              XData: [0 0.2618 0.5236 0.7854 1.0472 1.3090 1.5708 1.8326 2.0944 2.3562 2.6180 2.8798 3.1416 3.4034 3.6652 3.9270 4.1888 4.4506 4.7124 4.9742 5.2360 5.4978 5.7596 6.0214 6.2832]
              YData: [0 0.2588 0.5000 0.7071 0.8660 0.9659 1 0.9659 0.8660 0.7071 0.5000 0.2588 1.2246e-16 -0.2588 -0.5000 -0.7071 -0.8660 -0.9659 -1 -0.9659 -0.8660 -0.7071 -0.5000 -0.2588 -2.4493e-16]

  Show all properties
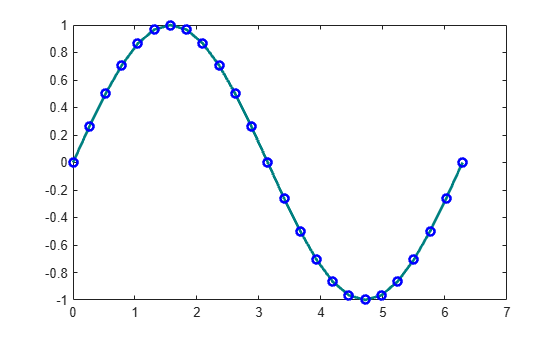
To access individual properties, use dot notation. For example, change the line width to 2 points and set the line color to an RGB triplet color value, in this case [0 0.5 0.5]. Add blue, circle markers.
ln.LineWidth = 2;
ln.Color = [0 0.5 0.5];
ln.Marker = 'o';
ln.MarkerEdgeColor = 'b';
See Also
plot | loglog | scatter | Line Properties