R2021b

New Features, Bug Fixes, Compatibility Considerations

Environment

Editor Selection: Select and edit a rectangular area of code

In the Editor, you now can select a rectangular area in your code (also known as column selection or block edit) by pressing the Alt key while making a selection with the mouse. On macOS systems, use the Option key instead. Selecting and editing a rectangular area of code is useful if you want to copy or delete several columns of data, or if you want to edit multiple lines at one time.

For example, select the second column of data in A.
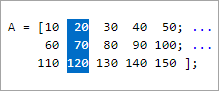
The variable A, defined as matrix with five columns and three rows. The second column of A is selected.

Type 0 to set all the selected values to 0.
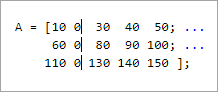
The variable A with the second column in the matrix set to all zeros.

Editor Display: Zoom in and out in the Editor

To zoom in or out in the Editor, go to the View tab, and in the Zoom section, select the Zoom In or Zoom Out button. As you zoom, MATLAB® displays the current scale in the bottom-right corner of the Editor. You also can hold the Ctrl key and move the scroll wheel, or press Ctrl+Plus and Ctrl+Minus. On macOS systems, use the Command key and move the scroll wheel, or press Command+Shift+Plus and Command+Shift+Minus.

To return to the default scale, in the View tab Zoom section, select Reset Zoom. You also can press Ctrl+Alt+0 (Command+Alt+0 on macOS).

Editor Code: Show code suggestions and completions automatically

Starting in R2021b, when you write commands in the Editor, MATLAB automatically displays contextual hints for arguments, property values, and alternative syntaxes. In previous releases, MATLAB only completes names in the Editor after a Tab key press.

For example, if you want to use the size function, MATLAB automatically displays the syntax information to help you write the command as you type.
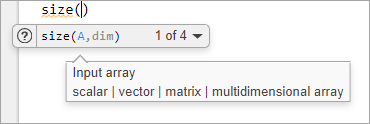
Code suggestion for the size function showing two input arguments, A and dim. The input argument A has the description "input array" underneath it.

MATLAB also automatically suggests and completes the names of functions, models, MATLAB objects, files, folders, variables, structures, graphics properties, parameters, and options.

You can disable automatic completions in the Editor and Live Editor by having MATLAB suggest and complete names only after you press the Tab key. To do so, on the View tab, in the Display section, click the Automatic Completions button off. You also can go to the Home tab, and in the Environment section, click Preferences. Then, select Editor/Debugger > Automatic Completions and in the Suggestions and completions section, select Show on tab.

For more information, see Check Syntax as You Type.

Editor Debugging: Diagnose problems in scripts and functions using inline debugging controls and a breadcrumb-style function call stack

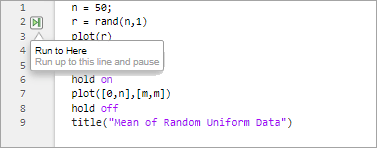
When debugging code in the Editor, you now can diagnose problems using inline debugging controls. For example, to run to a specific line of code and then pause, click the run to here button to the left of the line.

Script with nine lines of code and the run to here button displayed on line two.

To step into a file, click the step in button directly to the left of the function you want to step into. After stepping in, click the step out button at the top of the file to run the rest of the called function, leave the called function, and then pause.

By default, the step in button only appears for user-defined functions and scripts. To show the button for MathWorks® functions as well, on the Home tab, in the Environment section, click Preferences. Then, select MATLAB > Editor/Debugger, and in the Debugging in the Live Editor section, clear the Only show Step in button for user-defined functions option.

When you step into a called function or file, the Editor displays an improved breadcrumb-style list of the functions MATLAB executed before pausing at the current line (also called the function call stack). The function call stack is shown at the top of the file and displays the functions in order, starting on the left with the first called script or function, and ending on the right with the current script or function in which MATLAB is paused.

Bread-crumb style function call stack showing the two functions called, displayed left to right. The first function is plotRand the second function is mean. The step out button displays to the right of the function call stack.

For more information, see Debug MATLAB Code Files.

Editor Refactoring: Automatically convert selected code to a function

Break large scripts or functions into smaller pieces by converting selected code into functions in files or local functions. With one or more lines of code selected, on the Editor tab, in the Code section, click the Refactor button, and then select from the available options. MATLAB creates a function with the selected code and replaces the original code with a call to the newly created function.

Editor Code: Automatically complete block endings, match delimiters, and wrap comments while editing code

MATLAB now automatically completes parentheses and quotes when you enter code in the Editor. For example, if you type an open parenthesis in the Editor, MATLAB automatically adds the closing parenthesis. MATLAB also automatically completes comments, character vectors, strings, and parentheses split across two lines.

You also can have MATLAB automatically complete block endings. To do so, on the Home tab, in the Environment section, click Preferences. Select Editor/Debugger > Automatic Completions and in the Autocoding options section, select one or more of the Autocomplete block endings options.

To undo an automatic code completion, press Ctrl+Z or the Undo button. To disable automatic code completions, in the Editor/Debugger > Automatic Completions preferences, clear one or more of the options in the Autocoding options section.

Editor Sections: Create sections with an improved appearance

Starting in R2021b, sections in the Editor have an improved appearance. To create a new section, go to the Editor tab and in the Section section, click the Section Break button. The new section is highlighted with a blue border, indicating that it is selected.
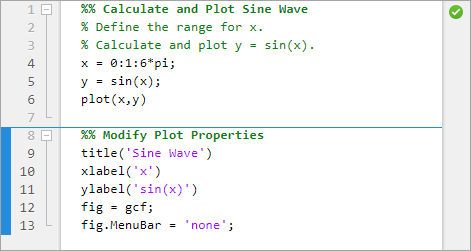
File open in the Editor showing two sections. The second section has a blue border around it indicating that it is the selected section.

To maximize the space available for editing code in the Editor, you can hide the Run to Here and Code Folding margins. This minimizes the gray area to the left of your code. To hide the two margins, right-click the gray area to the left of your code and clear the Show Run to Here Margin and Show Code Folding Margin options.
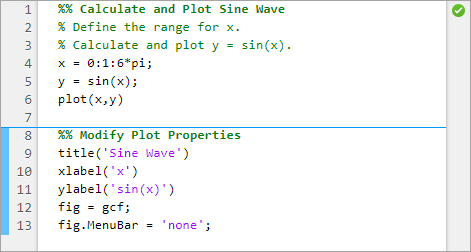
File open in the Editor showing the reduced gray area to the left of the code

As part of this change, the options for changing the appearance of code sections in the Editor have been removed. These options were previously available in the MATLAB > Colors > Programming Tools preferences, in the Section display options section.

For more information about sections in the Editor, see Create and Run Sections in Code.

Editor Code: Change the case of text and code

You can change the case of selected text or code in the Editor from all uppercase to lowercase, or vice versa. To change the case, select the text, right-click, and select Change Case. You also can press Ctrl+Shift+A to change the case. If the text contains both uppercase and lowercase text, MATLAB changes the case to all uppercase.

Editor Bookmarks: Maintain bookmarks after closing a file

Starting in R2021b, MATLAB maintains all bookmarks after you close a file in the Editor. In previous releases, MATLAB does not maintain bookmarks after closing a file.

For more information, see Go To Location in File.

Live Editor Controls: Set default values for sliders, drop-down lists, check boxes, and edit fields

You can set the default values for sliders, drop-down lists, check boxes, and edit fields in your live scripts. To set the default value for a control, right-click the control and select Configure Control. Then, in the Defaults section, specify a default value by entering the value or by selecting a workspace variable from the list. The list shows only valid variables for the control. For drop-down lists, select the default value from the list of items.

To restore the default value for a control, right-click the control and select Restore Default Value.

For more information, see Add Interactive Controls to a Live Script.

Live Editor Animations: Export animations to movies or animated GIFs

Export animations to movies or animated GIFs using the new Export Animation button in the Live Editor animation playback controls. The Export Animation button is not supported for animations generated by the movie function.

For example, this code animates a line growing as it accumulates 2000 data points in the Live Editor. When the animation is done playing, playback controls, including the new Export Animation button, display within the figure window.

h = animatedline;
axis([0 4*pi -1 1])
x = linspace(0,4*pi,2000);

for k = 1:length(x)
    y = sin(x(k));
    addpoints(h,x(k),y);
    drawnow
end
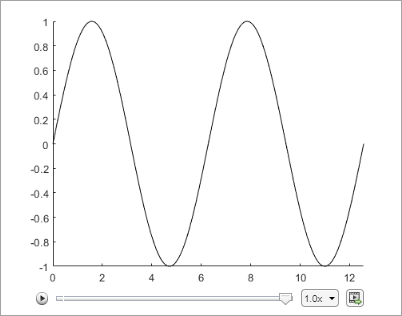
Figure window showing line after animation is done playing. Playback controls, including the new Export Animation button, display below the plot.

For more information about creating animations, see Animation Techniques.

Live Editor Figures: Interact with real MATLAB figures and resize them with improved layouts

Live Editor output figures are now real MATLAB figures with most of the interaction capabilities of standalone MATLAB figures. In addition, when you resize a figure in the Live Editor, the font sizes and spacing between elements in the figure now automatically adjust to provide the best possible presentation for the new size.

Live Editor: Improved performance when saving live scripts or functions

Saving live scripts and live functions in the Live Editor is faster in R2021b than in R2021a. The improvement is most noticeable when you save live functions with more than 1000 lines of code and live scripts with fewer than 100 lines of code.

For example, on a Windows® 10, Intel® Xeon® E5-1650 CPU @ 3.60 GHz test system, saving an example live function containing 4000 lines of code takes approximately 2.05 seconds in R2021b. In R2021a, saving the same live function takes approximately 2.57 seconds.

 Comparison Tool: Compare and merge text files with improved usability, appearance, and syntax highlighting

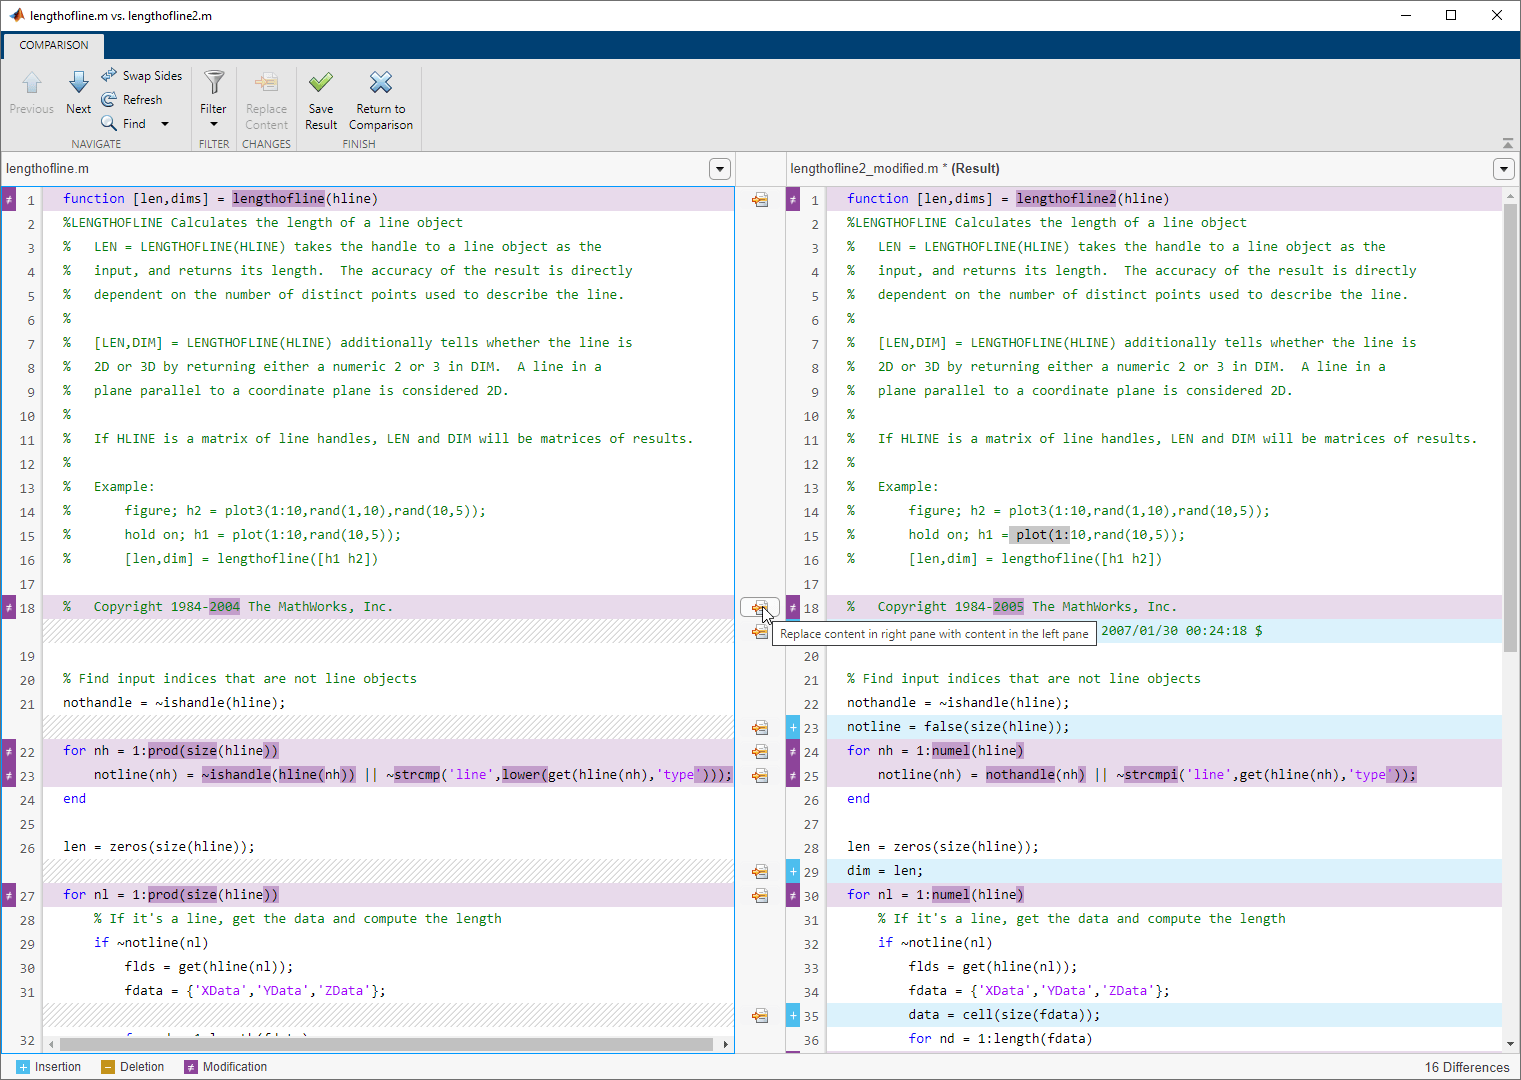
In R2021b, the comparison tool uses MATLAB Editor syntax highlighting. Text changes and merge choices are now easier to understand. Changes are highlighted with strong colors. Modified lines are highlighted and flagged with the comparison icons , , or . Merging line by line is straightforward, and merge choices are flagged with the merge content icon .

Text comparison report.

 Compatibility Considerations

Starting in R2021b, you no longer can save the comparison report as HTML or specify whether to show only the differences or the entire files.

Importing Preferences from Previous Releases: MATLAB checks for preferences from R2019b or newer

During start up, MATLAB checks for a preferences folder that matches the current release. If that folder is not found, MATLAB checks for preferences folders going back as far as R2019b. Releases before R2021b continue to check for up to three previous releases.

MATLAB ReleasePrevious Release Preferences Folders

R2021b

R2021a, R2020b, R2020a, R2019b

R2021a

R2020b, R2020a, R2019b

R2020b

R2020a, R2019b, R2019a

Display language: MATLAB uses Windows display language settings for selecting desktop language

MATLAB uses the Windows display language settings on Windows 10 to control the MATLAB desktop language. The display language you select on Windows changes the default language used by Windows features like settings and file explorer.

Prior to R2021b, MATLAB controlled the desktop language using the Windows locale setting which is managed in the Region settings.

For information about Windows locale settings in MATLAB, see Set Locale on Microsoft Windows Platforms.

For information about managing display language settings, refer to your Windows 10 documentation.

 Functionality being removed or changed

Increment Value and Run Section tool has been removed

The Increment Value and Run Section tool previously available in the Editor has been removed.

To increment a numeric value within a section, use controls in the Live Editor. For example, this code calculates the factorial of the variable x.

x = 5;
y = factorial(x)
y =
   120
To interactively change the value of x, in a live script, replace the value 5 with a numeric slider. By default, MATLAB reruns the current section when the value of the slider changes.
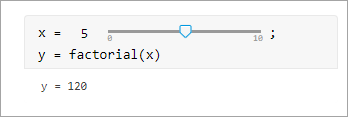
Code that calculates the factorial of x. The value of x is replaced with a numeric slider with a minimum value of 0, a maximum value of 10, and an actual value of 5.

For more information, see Add Interactive Controls to a Live Script.

Language and Programming

cast Function: Consistent output for all syntaxes with the same data type conversion

The cast function now returns consistent output for all syntaxes with the same data type conversion.

For example, starting in R2021b, both b = cast(fi(1),'like',sym(1)) and b = cast(fi(1),'sym') return b = 1 of the sym data type. In previous releases, b = cast(fi(1),'like',sym(1)) returns b = 1 of the sym data type, but b = cast(fi(1),'sym') throws an error.

Run Code in the Background: Use parallel language to run code asynchronously

You can now run code in the background using backgroundPool. When you run code in the background, you can:

  • Run other MATLAB code at the same time as a long running calculation

  • Create more responsive user interfaces

Use the background pool with the following parallel language:

For more information, see Background Processing.

Portable Parallel Code: Share parallel code and seamlessly run in parallel

You can now run parallel code even if you do not have Parallel Computing Toolbox™. When you run portable parallel code without Parallel Computing Toolbox, you run the code in serial on your machine. When you run this code with Parallel Computing Toolbox, you can automatically scale up and run the code in parallel on your local machine, on a remote cluster, or in the cloud.

The following parallel language features are available for prototyping:

  • parfeval — Seamlessly run multiple functions at once (since R2021b)

  • parfor — Seamlessly run for-loops in parallel (since R2008a)

For more information, see Run Parallel Language in MATLAB.

Compact Display for Classes: Customize display of information about classes when space is limited

Use the matlab.mixin.CustomCompactDisplayProvider class to customize how information about your classes is displayed in a container variable—such as a struct, cell array, or table—where space is limited. Options for customization include:

  • Displaying partial sets of data

  • Adding annotations

  • Controlling how and when class names are displayed

For example, an enumeration class of the days of the week, WeekDays, can be customized so that when arrays of WeekDays members cannot be fully displayed, MATLAB displays the size, the class, and an annotation. When the width of the Command Window is large enough, the full array is shown:

myStruc = 

  struct with fields:

    prop1: [Monday    Wednesday    Friday    Saturday    Sunday]

When the Command Window is not wide enough to display the full array, the size, the class, and an annotation are shown:

myStruc = 

  struct with fields:

    prop1: 1x5 Weekdays (Enum of days of week)

Class Aliasing: Create aliases for renamed classes to maintain backward compatibility

When you need to change a class name, you can create an alias to preserve compatibility with code written before the name change. The matlab.alias.AliasFileManager class provides an API for defining and implementing aliases. Once you define an alias, you can use the alias anywhere you use the class name. Aliases maintain backward compatibility when reloading objects with the old name into a MATLAB version that uses the new name, as well as forward compatibility when loading objects saved in a newer version into an older version that predates the definition of the alias. MATLAB substitutes the new class name whenever it encounters the old name.

Modular Indexing: Customize class indexing operations individually using new superclasses

To customize how indexing operations behave with your class in previous versions of MATLAB, you need to overload the subsref and subsasgn methods. Doing so requires implementing code for all indexing reference and assignment operations, including parentheses, dot, and brace operations, even if you want to change only one type of indexing operation.

Starting in R2021b, you can inherit from three new superclasses to customize parentheses, dot, and brace indexing operations individually:

You can inherit from one or more of these classes without affecting how the other indexing operations work. These classes also enable you to forward levels of indexing in compound statements to other MATLAB values. For example, your class can implement custom parentheses indexing for the first level of a compound reference and then allow MATLAB to apply the other levels to an object contained by your class.

Scalar Classes: Inherit from the matlab.mixin.Scalar superclass to ensure instances behave as scalars

Instances of classes that inherit from matlab.mixin.Scalar must behave as scalars. You cannot form arrays of instances of such a class, including empty arrays, and you cannot concatenate instances. This class is useful for cases in which concatenation does not make sense, like a dictionary or other container class in which parentheses indexing is customized to access data in the class, not to form or access arrays.

startat Function: Time zone information in datetime objects now supported

The startat function now recognizes time zone and daylight savings time information of datetime inputs.

 Functionality being removed or changed

newclass input argument of the syntax cast(A,newclass) is now case-sensitive

Behavior change

Starting in R2021b, the newclass input argument of the syntax cast(A,newclass) is case-sensitive. You must specify newclass as a character vector or a string of lowercase letters that represents the new data type.

For example, to convert a double value to the int8 data type, you must use b = cast(1.234,'int8'). The function syntax b = cast(1.234,'Int8') now throws an error.

Defining classes and packages: Using schema.m will not be supported in a future release

Still runs

Support for classes and packages defined using schema.m files will be removed in a future release. Replace existing schema-based classes with classes defined using the classdef keyword.

InexactCaseMatch and InexactCaseMatchForExtension Errors: These errors are replaced by UndefinedFunction error

Behavior change

The InexactCaseMatch and InexactCaseMatchForExtension errors have been removed and MATLAB throws an UndefinedFunction error instead. This change does not generate new errors in code that did not previously throw an error.

Data Analysis

Compute by Group Live Editor Task: Interactively summarize, transform, or filter groups of data

Use the Compute by Group Live Editor task to interactively compute statistics, transform data, or filter data by group. To open the task in the Live Editor, use the Task menu on the Live Editor tab.

Normalize Data Live Editor Task: Interactively center and scale data

Use the Normalize Data Live Editor task to visualize the effects of centering and scaling data using various methods, such as the z-score. To open the task in the Live Editor, use the Task menu on the Live Editor tab.

Clean Missing Data Live Editor Task: Define missing values

When using the Clean Missing Data Live Editor task, you can now define missing value indicators that are different from the standard MATLAB missing values.

trenddecomp Function: Find trends in data

Use the trenddecomp function to additively decompose data into a long-term trend and seasonal trends.

min and max Functions: Specify the comparison method for determining minimum and maximum values

The min and max functions now accept the 'ComparisonMethod' parameter, which specifies a method for determining the minimum and maximum values of the input while preserving the sign in the output.

uniquetol Function: Options to control element selection and preserve range of data

uniquetol has two new options to control behavior:

  • occurrence argument: Specify whether the algorithm begins with the highest or lowest elements in the input data. This can change which element, among several that are within tolerance of each other, is selected as being unique. The default is to begin with the lowest elements.

  • 'PreserveRange' name-value argument: Specify whether the range of the output data should be the same as the input data.

Data Preprocessing Functions: Specify table variable as sample points vector

When you operate on table input data, the following functions now allow you to specify which variable in the table to use with the 'SamplePoints' parameter:

dateshift Function: Shift to next occurrence of weekday or weekend day

You can now use the 'weekday' and 'weekend' arguments to shift the elements of a datetime array when using the dateshift function.

  • To shift to the next occurrence of a weekday on or after each element of the input datetime array, use 'weekday'.

  • To shift to the next occurrence of a weekend day on or after each element of the input datetime array, use 'weekend'.

isbetween Function: Support for open, closed, and half open intervals

The isbetween function now supports open, closed, and half open intervals. In previous releases, isbetween supports only closed intervals.

isregular Function: Support for datetime and duration data types

You can now use the isregular function to determine if a timetable, datetime vector, or duration vector is regular. In previous releases, you can use isregular only on a timetable.

istabular Function: Determine if input is a table or timetable

To determine if an input variable is either a table or a timetable, use the istabular function.

Using this function is equivalent to using the statement tf = istable(A) || istimetable(A), but is more convenient.

retime and synchronize Functions: Median and mode methods supported

When you synchronize data in timetables, you can now specify 'median' and 'mode' as aggregation functions. For more information, see retime and synchronize.

timeofday Function: Return the date as the second output argument

You can now return the dates from the elements of a datetime array as the second output argument from the timeofday function.

timeseries2timetable Function: Convert timeseries objects to timetables

To convert timeseries objects to timetables, use the timeseries2timetable function.

 Functionality being removed or changed

isordinal accepts input argument that has any data type

Behavior change

The isordinal function now accepts an input argument that has any data type. In previous releases, isordinal threw an error if the input argument was not a categorical array.

Synchronize Timetables Live Editor task synchronizes an unlimited number of timetables

Behavior change

The Synchronize Timetables Live Editor task can now synchronize an unlimited number of timetables. In previous releases, the task can synchronize no more than five timetables.

timeseries2timetable replaces ts2timetable

Behavior change

The timeseries2timetable function replaces the ts2timetable function, although ts2timetable is still provided. The two functions are synonyms. In R2021a, MATLAB provides ts2timetable only.

Data Import and Export

sftp Function: Connect to SFTP servers

MATLAB can connect to SFTP servers for encrypted data transfers. Create an SFTP connection object using the sftp function to read data from an SFTP server.

Datastores: Specify FileSet objects as data locations for some datastores

Some datastore functions and objects accept FileSet objects as the locations of files to include in the datastore. FileSet objects provide increased performance compared to file paths or DsFileSet objects. This functionality is supported by these functions:

  • tabularTextDatastore

  • spreadsheetDatastore

  • fileDatastore

  • keyValueDatastore

  • tallDatastore

  • parquetDatastore

  • imageDatastore

  • signalDatastore (Signal Processing Toolbox)

  • audioDatastore (Audio Toolbox)

  • mdfDatastore (Vehicle Network Toolbox)

Table Import: Read tables from HTML and Microsoft Word documents

The readtable function now supports reading tables from HTML and Microsoft® Word files.

To customize import options for HTML and Microsoft Word files, use htmlImportOptions and wordDocumentImportOptions, respectively. To automatically detect import options from files, use the detectImportOptions function.

HDF5 Interface: Use new functionality in support of HDF5 1.10.7

Use these new capabilities of the MATLAB HDF5 function interfaces:

  • Single-Writer/Multiple-Reader (SWMR) — Write data to an HDF5 file in one process while you concurrently read from the file in one or more reader processes. For more information, see Read and Write Data Concurrently Using Single-Writer/Multiple-Reader (SWMR).

  • Virtual Dataset (VDS) — Use the MATLAB low-level interface to access data stored across multiple HDF5 files, including files in remote locations, as a single, unified HDF5 dataset. You can also read data stored in Virtual Datasets using the HDF5 high-level interface. For more information, see Work with HDF5 Virtual Datasets (VDS).

  • Metadata Cache Fine-Tuning — Improve performance by controlling the parameters of the metadata cache, such as limiting the number of file reading attempts.

  • Partial Edge Chunk — Control whether to filter partial edge chunks.

NetCDF Interface: Read and write NC_STRING data

You can now use the existing high-level and low-level functions to read NC_STRING data from NetCDF-4 files and write text data as type NC_STRING.

For more information on data type mapping between the NetCDF API and MATLAB, see Map NetCDF API Syntax to MATLAB Syntax.

Scientific File Format Libraries: HDF5 and NetCDF libraries are upgraded

The HDF5 library is upgraded to version 1.10.7, and the NetCDF library is upgraded to version 4.7.4.

Audio, Video, and Image I/O Functions: Run functions in a thread-based environment

You can now run the following functions in the background using MATLAB backgroundPool:

For more information, see Run MATLAB Functions in Thread-Based Environment.

Image File Format Libraries: LibTIFF library upgraded to version 4.2.0

The LibTIFF library is upgraded to version 4.2.0.

New Serial Explorer and TCP/IP Explorer apps

Two new apps offer functionality for communicating with your device, instrument, or server:

  • The Serial Explorer app provides a user interface to connect to and communicate with a serial port device on your machine.

  • The TCP/IP Explorer app provides a user interface to create a TCP/IP client that communicates with a TCP/IP server.

Launch these apps from the Apps tab, under the Test and Measurement section. You can also call the serialExplorer and tcpipExplorer commands in the Command Window.

You can use the apps to perform the following operations on your serial port device or TCP/IP client.

  • Configure connection and communication properties.

  • Write binary or string data.

  • Read binary or string data.

  • Plot data in a separate figure window.

  • Analyze data by viewing it in the Signal Analyzer app.

  • Export data to the MATLAB workspace.

  • Generate a MATLAB script for app interactions that uses the serialport or tcpclient interface.

For more information about these apps, see Serial Explorer and TCP/IP Explorer.

 Functionality being removed or changed

Video and Image I/O Functions: Pixel value differences might exist between JPEG 2000 images in R2021b and previous versions of MATLAB

Behavior change

In R2021b, when you use the imread, imwrite, VideoReader, or VideoWriter functions to read or write JPEG 2000 image files, the image you import or export in R2021b might have pixel value differences with the same image in previous versions of MATLAB.

HDF5 Interface: Linux users need to rebuild filter plugins using MATLAB HDF5 1.10.7 shared library

Behavior change

Starting in R2021b, in certain cases, Linux® users using a filter plugin with callbacks to core HDF5 library functions need to rebuild the plugin using the shipping MATLAB HDF5 1.10.7 shared library, /matlab/bin/glnxa64/libhdf5.so.103.3.0. If you do not rebuild the plugin using this version of the shared library, you might experience issues ranging from undefined behavior to crashes. For more information, see Build HDF5 Filter Plugins on Linux Using MATLAB HDF5 Shared Library or GNU Export Map.

ftp Function: FTPClientConfig class, properties, and methods are no longer supported

The ftp function no longer supports the Apache® FTPClientConfig class or any associated objects, properties, or methods. To customize how to parse the LIST command output of the FTP server use the ftp function’s DirParserFcn name-value argument.

MATLAB Variable Editor: timeseries will no longer be supported in a future release

Still runs

Viewing timeseries objects using the MATLAB Variable Editor will no longer be supported in a future release. To view time-indexed data in the Variable Editor, use timetable instead.

Mathematics

ode78 and ode89 Functions: High-order Runge-Kutta solvers for ordinary differential equations

The MATLAB ODE suite has been expanded with two new solvers:

  • ode78 uses 7th- and 8th-order Runge-Kutta formulas

  • ode89 uses 8th- and 9th-order Runge-Kutta formulas

The new solvers expand on the existing Runge-Kutta solvers ode23 and ode45. In particular, ode78 and ode89 can be more efficient than ode45 on nonstiff problems that are smooth, and ode89 can be more efficient than ode78 on very smooth problems, when you integrate over long time intervals or when tolerances are tight.

pagesvd Function: Perform singular value decomposition on pages of N-D arrays

Use the pagesvd function to perform batched singular value decompositions on the pages of N-D arrays. In this context, the N-D array is treated as a container for several 2-D matrices.

svd Function: Option to control output format of singular values

svd has a new option outputFormat to control whether the singular values are returned as a vector or diagonal matrix.

mpower Function: Improved algorithm for defective matrices

The mpower function has an improved algorithm to handle defective matrices raised to a real power. In previous releases, mpower uses an algorithm based on eigenvalue decomposition for these inputs that can return incorrect results for defective matrices. The new algorithm for defective matrices is instead based on the Schur decomposition.

 Functionality being removed or changed

svd, eig, cond, and pinv functions return NaN for nonfinite inputs

Behavior change

In R2021b, the svd, eig, cond, and pinv functions return NaN values when the input contains nonfinite values (Inf or NaN).

In previous releases, these functions throw an error when the input contains nonfinite values.

Graphics

Plotting Table Data: Create scatter plots, bubble charts, and swarm charts by passing tables directly to plotting functions

Create plots by passing a table directly to any of these functions: scatter, scatter3, bubblechart, bubblechart3, swarmchart, swarmchart3, polarscatter, and polarbubblechart. When you specify your data as a table, the axis labels and the legend (if present) are automatically labeled using the table variable names.

The objects returned by these functions have new properties to support tables.

PropertyDescription

SourceTable

Table containing the data to plot

XVariable, YVariable, and ZVariable

Table variables containing the x, y, and z values for Cartesian plots

ThetaVariable and RVariable

Table variables containing the angle and radius values for polar plots

SizeVariable

Table variable containing the marker size data

ColorVariable

Table variable containing the marker color data

AlphaVariable

Table variable containing the marker transparency data

For example, create a table with the variables "Trials" and "Response". Pass the table to the scatter function as the first argument, and indicate the variables you want to plot by name.

Trials = randi(10,50,1);
Response = rand(50,1);
t = table(Trials,Response);
scatter(t,"Trials","Response")
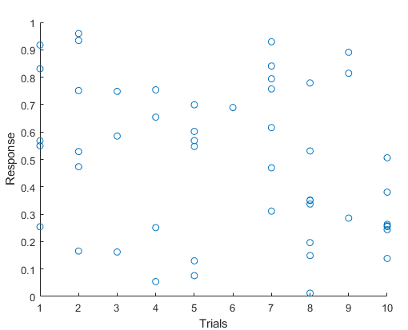
Scatter plot with x- and y-axis labels that reflect the table variable names.

Axes Ticks and Colors: Control the appearance of axis tick marks and tick label colors

Now, you can remove tick marks and customize tick label colors independently of other elements in the axes.

  • Removing Tick Marks — Remove all the tick marks from an axes, polar axes, or geographic axes object by setting the TickDir property to 'none'. To remove the tick marks from a specific axis, for example the x-axis, set the TickDirection property of the ruler to 'none'.

  • Customizing Tick Label Colors — Customize the color of the tick labels on an axis by setting the TickLabelColor property of the corresponding ruler object. You can customize tick label colors for any axes, polar axes, or geographic axes.

For example, create a bar chart, and then get the current axes. Remove the x-axis tick marks and change the color of the x-axis tick labels to red.

bar([2017 2018 2019 2020],1:4)
ax = gca;
ax.XAxis.TickDirection = 'none';
ax.XAxis.TickLabelColor = 'r';
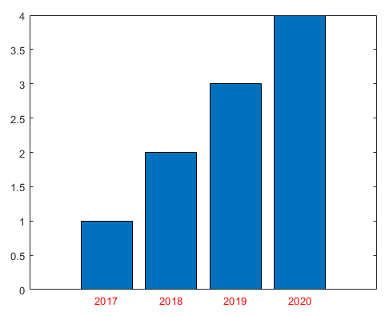
Scatter plot with x-axis label and legend labels that reflect the table variable names.

Create Plot Live Task: Add additional visualizations to generated plots

Easily add additional visualizations to plots generated using the Create Plot Live Task. To add a new plot, click the Add tab at the bottom of the Live Task Panel and select the visualization and data. This Live Task combines the plot using the hold function.
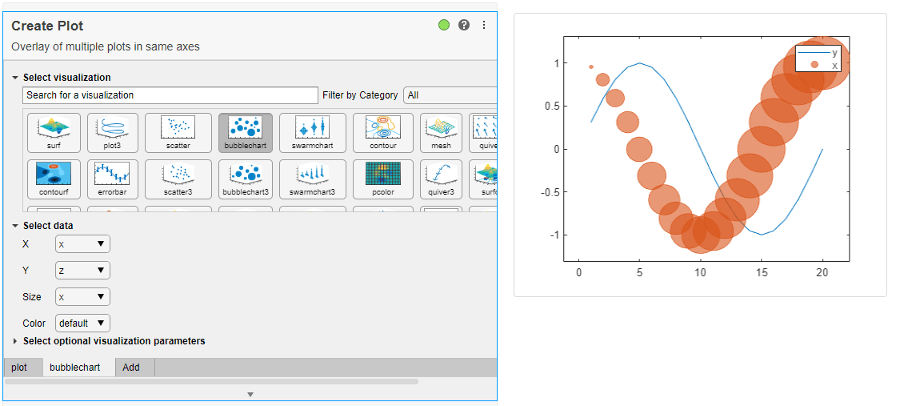
A Screen shot of the Create Plot Live Task showing a line plot of a sine wave in blue and a bubble plot of a cosine wave in orange.

Create Plot Live Task: Control chart input syntax using configuration drop-down

The Create Plot Live Task now supports multiple configurations of charting functions with multiple input syntaxes, including surf and mesh. Use the Configurations drop-down menu to select the desired configuration.
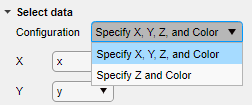
A screenshot of the configuration drop-down menu for a surf plot

exportgraphics Function: Capture and append graphics to existing PDFs

Capture and append graphics to an existing PDF file by calling the exportgraphics function and setting the 'Append' name-value argument to true. For example, create a plot and export it as a PDF called 'mycharts.pdf'. Then, create a bar chart and append it to the end of 'mycharts.pdf'. The resulting PDF file has two pages. The plots appear in the PDF in the order that you export them.

plot([0 3 1 6 4 10])
exportgraphics(gca,'mycharts.pdf')
bar([10 20 30 40])
exportgraphics(gca,'mycharts.pdf','Append',true)

stackedplot Function: Support for semilog y-axes

You can create plots using the stackedplot function where individual y-axes can be plotted on a log scale. To set a log scale for the y-axis of a plot, set the YScale property of the StackedAxesProperties object associated with the plot. For more information, see StackedAxesProperties Properties.

Text Objects: Use editInteractions in the Interactions property to click or tap on text to edit

Click or tap to edit text when the Interactions property has the value editInteraction. The edit interaction is default behavior for title, subtitle, xlabel, ylabel, and zlabel text objects for axes, geographic axes, and polar axes.

dataTipTextRow Function: Customize data tip content using data properties, such as UserData

You can now assign information to the DataTipTemplate property by passing it to the dataTipTextRow function as a property name, such as UserData.

p = patch;
p.UserData = p.XData;
p.DataTipTemplate.DataTipRows(3) = dataTipTextRow('XDataAsUserData','UserData');

MATLAB Online™ Accessibility: Use a screen reader to interact with figures

In MATLAB Online™, you can use a screen reader and keyboard commands to pan, zoom, and rotate when you work with plotted data. Using a screen reader is not supported in the Live Editor.

For more information, see Use a Screen Reader in MATLAB Online.

For more details on interacting with MATLAB figures, see Control Chart Interactivity.

 Functionality being removed or changed

The print options -opengl and -painters are not recommended

Still runs

The following print options are no longer recommended. There are no plans to remove the values, and they will continue to behave the same way as in previous releases. The following table lists the recommended replacement options.

Not RecommendedReplacement Option

The -opengl renderer option. For example:

print('-opengl','-dpdf','myfigure.pdf')

Use the -image option. For example:

print('-image','-dpdf','myfigure.pdf')

The -painters renderer option. For example:

print('-painters','-dpdf','myfigure.pdf')

Use the -vector option. For example:

print('-vector','-dpdf','myfigure.pdf')

plottools functions will be removed in a future release

Still runs

The plottools functions listed below will be removed in a future release. Use inspect to launch the Property Inspector instead.

plottools functions

App Building

uialert, uiconfirm, and uiprogressdlg Functions: Mark up text and display equations in dialog boxes

When you create dialog boxes using the uialert, uiconfirm, and uiprogressdlg functions, enable markup in the dialog box text using the Interpreter name-value argument. Specify the interpreter as 'html', 'latex', 'tex', or 'none'.

addStyle Function: Add styles to nodes and levels in a tree UI component

Create styles for specific tree nodes or tree node levels in a tree UI component using the uistyle and addStyle functions. For example, you can make the tree nodes at the top level of the tree red with italic font. To get information on applied styles, query the StyleConfigurations property of the Tree object. To remove a style from a tree, use the removeStyle function.

uitable Function: Set and query table selections programmatically and control table selection options

You can now configure selection options of table UI components.

  • Set and query the table selection using the Selection property.

  • Specify whether a user can select table cells, rows, or columns using the SelectionType property.

  • Specify whether a user can select single or multiple table elements using the Multiselect property.

  • Update your app whenever a user selects table data by specifying a SelectionChangedFcn callback.

Selection options in table UI components are supported only in App Designer apps and in figures created with the uifigure function.

For more information, see Table Properties.

uitextarea Function: Program apps to respond while a user is typing in a text area component

You can now specify a ValueChangingFcn callback for a TextArea component. The component executes the callback function repeatedly while a user types in the text area.

For more information, see TextArea Properties.

Run Code in the Background: Use parallel language to create more responsive apps

You can now create apps that remain responsive while performing calculations in the background by using backgroundPool.

Use the background pool with the following parallel language:

For more information, see Use the Background to Make Your Apps More Responsive.

App Designer: Debug code in Code View

When debugging code in App Designer, you now can diagnose problems using debugging controls in Code View. You can use the controls in the Run section of the Editor tab to run to the next breakpoint, run the next line of code, or step into or out of a function.
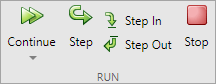
Debugging controls in App Designer. There are five buttons: Continue, Step, Step In, Step Out, and Stop.

You can also debug your app code using inline debugging controls. For example, to run to a specific line of code and then pause, click the run to here button to the left of the line. To step into a function, click the step in button directly to the left of the function you want to step into. After stepping in, click the step out button at the top of the file to run the rest of the called function, leave the called function, and then pause.

When you step into a called function or file, App Designer displays a breadcrumb-style list of the functions MATLAB executed before pausing at the current line (also called the function call stack). The function call stack is shown at the top of the file and displays the functions in order, starting on the left with the first called script or function, and ending on the right with the current script or function in which MATLAB is paused.

Bread-crumb style function call stack showing the two functions called, displayed left to right. The first function is plotRand the second function is mean. The step out button displays to the right of the function call stack.

 App Designer: Efficiently manage your app code with tools and shortcuts from Live Editor

Many of the tools and shortcuts for navigating and organizing code that are available in the Live Editor can now be used in App Designer Code View. This table lists the functionality that is new to App Designer.

FunctionalityMenu ItemKeyboard Shortcut
Wrap comment

Right-click the comment and select Wrap Comments, or in the Editor tab, in the Code section, click the Wrap comment button.

Ctrl+J
Navigate code using bookmarks

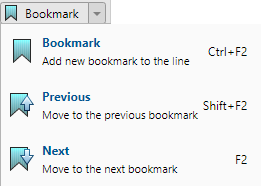
In the Editor tab, in the Navigate section, click Bookmark. Then, select Bookmark to set or clear a bookmark on the current line, or select Previous or Next to navigate between the existing bookmarks.

Drop-down with bookmark options

Set or clear bookmark: Ctrl+F2
Move to previous bookmark: Shift+F2
Move to next bookmark F2
Print app code

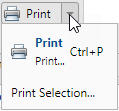
In the Editor tab, in the File section, click Print. You can print the entire document or the current selection.

App designer print options menu.

Ctrl+P
Fold and expand code

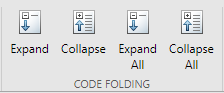
In the View tab, click the buttons in the Code Folding section.

Code folding options to expand, collapse, expand all, or collapse all.

Expand current fold: Ctrl+Shift+Period (.)
Collapse current fold: Ctrl+Period (.)
Expand all folds: Ctrl+Shift+Comma (,)
Collapse all folds: Ctrl+Comma (,)
Toggle display preferences

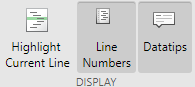
In the View tab, in the Display section, toggle line highlighting and line numbers.

App Designer display options. The options are: Highlight Current Line, Line Numbers, and Datatips.

N/A
Duplicate lineRight-click a line and select Duplicate Line(s). Ctrl+Shift+C
Insert section breakRight-click a line and select Section Break.Ctrl+Alt+Enter, or type %%
Convert text to uppercase or lowercaseHighlight the text, right-click it, and select Change Case.Ctrl+Shift+A
Variable rename

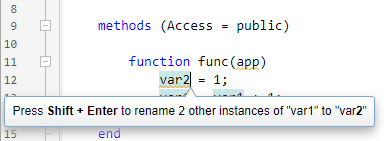
When you rename a variable, App Designer gives you the option to automatically update all other instances of the variable in your code.

Tooltip prompting variable renaming in App Designer

Shift+Enter
 Compatibility Considerations

Code folding in App Designer persists even after you close and then reopen the file. In R2021a and earlier releases, when opening a file, App Designer expands all the code.

App Designer: Interactively modify canvas zoom level and fit canvas to view

In Design View, use the zoom controls in the lower right corner of the App Designer canvas, indicated by the Zoom icon button, to modify the canvas zoom level.

To automatically zoom to fit the entire app in the view, press Space. Alternatively, click Fit to View in the Zoom section of the View tab, or right-click on the canvas and select Zoom > Fit to View.

App Designer: Convert between similar UI components

To convert one type of UI component to another with similar functionality, right-click the component on the canvas or in the Component Browser and select Replace With. Then, select the component to convert to. Replacing one component with another preserves relevant property values, such as font properties and callbacks that exist for both components. You can convert component types within each of these families:

  • Numeric edit field, spinner, slider, and knob

  • Edit field and text area

  • Label and hyperlink

App Designer: Add help text for your app

You can now provide help for apps that you create. Help text appears in the Command Window when an app user calls the help function and specifies the name of the app.

To add help text, in the Editor tab in Code View, click App Help Text. Use the App Help Text dialog box to specify the app summary and detailed explanation.

In addition, when an app user views the documentation for your app (for example, by calling the doc function or by clicking the documentation link in the help text for the app), the documentation page now displays additional information:

  • The top of the page displays the app summary and detailed explanation.

  • The Methods Summary section displays the public functions. For each function, it also displays any comment that is inserted after the function definition statement.

App Designer: Remove auto-reflow behavior from an app with auto-reflow

To convert an app with auto-reflow to an app without auto-reflow, in the Canvas tab in Design View, click Convert. Select the App without Auto-Reflow option. Doing so creates a duplicate of your app with the auto-reflow behavior removed.

For more information, see Apps with Auto-Reflow.

Deployed Web Apps: Deploy web apps directly to the MATLAB Web App Server from within App Designer

Once you have MATLAB Compiler™ installed on the system running MATLAB, package your MATLAB app into a web app from within App Designer by clicking Share in the Designer tab and selecting Web App. In the packaging dialog, specify the server URL to directly deploy your web app to the server once packaging is complete. Authentication must be enabled on the server for this to work. For details, see Authentication (MATLAB Web App Server).

App Testing Framework: Perform press gestures on axes and UI axes with different selection types

The app testing framework now supports mouse selection types in press gestures that are performed on axes and UI axes. For example, create an axes with a plot and then test a double-click gesture at the point (3, 2).

f = uifigure;
ax = axes(f);
plot(ax,1:10)
tc = matlab.uitest.TestCase.forInteractiveUse;
tc.press(ax,[3 2],'SelectionType','open')

App Testing Framework: Perform drag gestures on axes and figures with different selection types

Starting in R2021b, the app testing framework supports drag gestures on UI figures. Additionally, when you test a drag gesture on an axes, UI axes, or UI figure, you can specify the mouse selection type. For example, create a figure and drag on it from the point (100, 200) to the point (200, 300) using a right-click gesture.

f = uifigure;
tc = matlab.uitest.TestCase.forInteractiveUse;
tc.drag(f,[100 200],[200 300],'SelectionType','alt')

App Testing Framework: Use any units of measurement in gestures at the center of components

Starting in R2021b, when you perform a gesture at the center of a component, the component or its parent containers can use any units of measurement. In previous releases, the framework does not support containers that use nonpixel units.

For example, create a figure and set its Units property to 'normalized'. Then, create a panel in the figure and press at the center of the panel.

f = uifigure;
f.Units = 'normalized';
p = uipanel(f);
tc = matlab.uitest.TestCase.forInteractiveUse;
tc.press(p)

If you perform a gesture at the center of a component using a syntax that accepts location as an input (for instance, press(testcase,comp,location)), then the figure or parent containers can use only 'pixels' as their units of measurement.

 Functionality being removed or changed

Ctrl+Click selects and deselects cells in a table UI component

Behavior change

In tables created using the uitable function, you can select and deselect noncontiguous table cells by holding Ctrl and clicking a cell. In R2021a and earlier releases, Ctrl+Click gives focus to a cell and Shift+Click selects the cell that has focus.

App Designer toolstrip organization has changed

Behavior change

The organization of the tools in the App Designer toolstrip in Design View and Code View has changed.

In Design View, use the tools in the Canvas tab to lay out your app, and use the tools in the View tab to manage your Design View preferences.

In Code View, use the tools in the Editor tab to program your app behavior and to run and debug your app, and use the tools in the View tab to manage your Code View preferences.

matlab.fonts.editor.codefont.Size setting has been removed

Errors

The matlab.fonts.editor.codefont.Size setting has been removed. Use the matlab.fonts.codefont.Size setting instead. The matlab.fonts.codefont.Size setting controls both the App Designer Code View font size and the desktop code font size.

To update your code, change instances of the setting matlab.fonts.editor.codefont.Size to matlab.fonts.codefont.Size. For more information, see matlab.fonts Settings.

App Designer Smart Indent applies to individual lines

Behavior change

When you apply Smart Indent to code in App Designer, the indentation change applies only to the current line. In R2021a and earlier releases, the Smart Indent option applied to the entire document.

To apply Smart Indent to the entire document, in Code View, first select all the code (for example, by pressing Ctrl+A). Then, apply Smart Indent by clicking the Smart indent button in the Editor tab, or pressing Ctrl+I.

CellSelectionCallback property of table UI components is not recommended in uifigure-based apps

Still runs

Starting in R2021b, using the CellSelectionCallback property to program a response to table selection is not recommended for table UI components in App Designer apps and in figures created with the uifigure function. Use the SelectionChangedFcn property instead.

To update your code, assign all callback functions assigned to the CellSelectionCallback property to the SelectionChangedFcn property instead. If a callback function accesses the callback event data, you might need to update the event property names. For example, to access the indices of the elements the user selected, use the Selection property of the TableSelectionChangedData object. For more information, see Table Properties.

Performance

table Data Type Indexing: Improved performance when assigning elements by subscripting with curly braces

table subscripted assignment using curly braces is significantly faster in R2021b than in R2021a.

For example, when you assign into three table variables with 106 elements, performance in R2021b is approximately 4.4x faster, as shown below.

function timingTest()
    t = table(zeros(1e6,1), ones(1e6,1), nan(1e6,1));
    indices = randi(1e6,1,10000);

    tic;
    % Assign row vector of random values to randomly chosen row
    for i = indices
        t{i,:} = rand(1,3);
    end
    toc
end

The approximate execution times are:

R2021a: 7.4 s

R2021b: 1.7 s

The code was timed on a Windows 10 system with a 3.6 GHz Intel Xeon W-2133 CPU by calling the timingTest function in R2021a and R2021b.

qrinsert and qrdelete Functions: Improved performance modifying QR factorizations

The qrinsert and qrdelete functions show improved performance inserting and deleting rows and columns in a QR factorization. The speedup is most noticeable for square matrices of order 1000 or less and is similar in magnitude for both rows and columns.

For example, this code uses a loop to insert and delete columns from the QR factorization of a random 200-by-200 matrix. qrinsert and qrdelete are about 12x faster than in the previous release.

function timingQRMod
X = rand(200);
[Q,R] = qr(X);
y = rand(200,1);
tic
for k = 1:1000
    [Qn,Rn] = qrinsert(Q,R,100,y);
end
toc
tic
for k = 1:1000
    [Qn,Rn] = qrdelete(Q,R,100);
end
toc
end

The approximate execution times are:

R2021a: 1.7 s (insertion) and 1.2 s (deletion)

R2021b: 0.15 s (insertion) and 0.10 s (deletion)

The code was timed on a Windows 10, Intel Xeon W-2133 CPU @ 3.60 GHz test system by calling the timingQRMod function.

Titles and Labels in Plots: Improved performance when creating and querying titles or labels in a loop

Creating and querying the following types of titles and labels in a loop has improved performance.

  • Plot titles, such as those created with the title or subtitle functions

  • Axis labels, such as those created with the xlabel, ylabel, or zlabel functions

For example, this code creates 100 axes with titles in a tiled chart layout. It runs 11.9x faster than in the previous release:

function timingTitle
tiledlayout(10,10);
for n = 1:100
    nexttile
    title(n)
end
end

The approximate execution times are:

R2021a: 9.5 s

R2021b: 0.8 s

The code was timed on a Windows 10, Intel Xeon CPU E5-1650 v4 @ 3.60 GHz test system by calling the timeit function:

timeit(@timingTitle)

The performance gains increase with the number of axes, titles, and axis labels you are working with. For example, this table shows the improvements for looping over 10, 20, 50, and 100 axes with titles.

Number of Axes with TitlesPerformance Gain
102.5x
204.2x
507.0x
10011.9x

Plot Interactions: Improved performance for rendering data tips and rotating scatter plots of large data sets

In figures created with the uifigure function and in MATLAB Online™, interactions with scatter plots of large data sets have the following performance improvements:

  • Data tip markers track the mouse motion more closely.

  • 3-D scatter plots are more responsive to rotation gestures.

This improvement can be seen when the axes are created with either the axes or uiaxes function.

For example, on a Windows 10, Intel Xeon CPU E5-1650 v4 @ 3.60 GHz system, when you hover the cursor over the following sphere, the cursor changes to a crosshair more quickly, and the data tip markers track the cursor more closely. When you click and drag the cursor within the axes, the sphere rotates more quickly and tracks the cursor more closely.

f = uifigure;
ax = axes(f);
[X,Y,Z] = sphere(900);
scatter3(ax,X(:),Y(:),Z(:),[],Z(:),".")
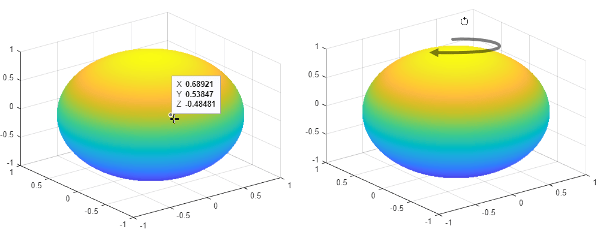
Two spheres created with approximately 800,000 scattered points. The first sphere shows a data tip and its marker, and the second shows the cursor in rotation mode.

Plots in Apps: Improved performance for creating plots

The performance is improved for creating plots in apps or in figures created with the uifigure function. For example, create a figure and an axes object. Then plot 10,000 points. This code runs 14x faster in R2021b.

function timingPlot
% Create figure and axes
f = uifigure;
ax = axes(f);
drawnow;

% Create data vector
y = rand(1,10000);

% Plot the data
tic;
plot(ax,y);
toc;
end

The approximate execution times are:

R2021a: 0.14 s

R2021b: 0.01 s

The code was timed on a Windows 10, Intel Xeon W-2133 CPU @ 3.60 GHz test system by calling the timingPlot function.

App Designer: Improved performance when opening Start Page and loading apps

When you use App Designer, these operations have improved performance:

  • Opening the App Designer Start Page

  • Opening an existing app

For example, opening App Designer by entering appdesigner in the Command Window loads the Start Page approximately 1.8x faster in R2021b than in R2021a the first time it is opened, and 2.1x faster in subsequent times. The approximate startup times are:

ReleaseFirst StartupSubsequent Startups
R2021a6.6 s3.6 s
R2021b3.6 s1.7 s

Also, loading an app in App Designer shows improved performance. For example, after creating and saving a new blank app, opening the app in App Designer is about 1.3x faster in R2021b than in R2021a. The approximate loading times are:

R2021a: 1.98 s

R2021b: 1.56 s

The performance improvement is larger if you have additional toolboxes installed.

These operations were timed on a Windows 10, Intel Core® i7-5600 CPU @ 2.60 GHz test system.

App Designer: Improved performance when saving apps

Saving apps in App Designer after you edit an app function or property is faster in R2021b than in R2021a. The more lines of code in the app file, the greater the performance improvement becomes.

For example, on a Windows 10, Intel Xeon W-2133 CPU @ 3.60 GHz test system, in an app containing 10,000 lines of code, if you click Property to create a new property and then click Save to save the app, you can run the updated app sooner in R2021b than in R2021a.

The approximate save times are:

R2021a: 20 s

R2021b: 1.5 s

Comparison Tool: Improved performance when loading and saving MLAPP files

When you use the Comparison Tool to compare and merge changes between app code in MLAPP files, these operations have improved performance:

  • Loading the files into the Comparison Tool

  • Saving the files after merging changes

For example, if you load two apps with 5000 lines of code into the Comparison Tool by clicking Compare in the App Designer toolstrip, you can compare and merge the files sooner in R2021b than in R2021a.

The approximate loading times are:

R2021a: 13 s

R2021b: 8 s

Also, if you use the Comparison Tool to merge changes between two apps with 5000 lines of code (for example, by clicking Merge Mode , merging the changes, and then clicking Save Result ), you can compare the saved files sooner in R2021b than in R2021a.

The approximate save times are:

R2021a: 24 s

R2021b: 8 s

Both of these operations were timed on a Windows 10, Intel Xeon W-2133 CPU @ 3.60 GHz test system.

uigridlayout Function: Improved performance when adding components spanning multiple columns with 'fit' width

The performance of parenting components to a grid layout manager created using the uigridlayout function has improved when the components span multiple columns with a ColumnWidth value of 'fit'. The performance improvement gets better as the number of components spanning multiple columns and the number of columns spanned increases.

For example, this code creates a grid layout manager with 10 columns with a ColumnWidth value of 'fit', and then creates 50 labels that span all 10 columns. Performance in R2021b is about 4.7x faster than in R2021a.

function timingGridLayout
f = uifigure;
numrows = 50;
numcols = 10;
g = uigridlayout(f);
g.Scrollable = 'on';
g.RowHeight = repmat({'fit'},1,numrows);
g.ColumnWidth = repmat({'fit'},1,numcols);
drawnow

tic
for row = 1:numrows
    txt = ['This is a label in row ' num2str(row) ' that spans ' ...
        num2str(numcols) ' columns in the grid.'];
    lbl = uilabel(g,'Text',txt);
    lbl.Layout.Column = [1 numcols];
end
drawnow
toc
end

The approximate execution times are:

R2021a: 5.2 s

R2021b: 1.1 s

The code was timed on a Windows 10, Intel Xeon CPU E5-1650 v4 @ 3.60 GHz test system by calling the function timingGridLayout.

uigridlayout Function: Improved resizing performance when wrapping text in resizable columns

The performance when you resize apps containing a grid layout manager created using the uigridlayout function has improved when both of these conditions hold:

  • The grid layout manager contains a component with a WordWrap value of 'on'.

  • The row and column containing the component with word wrap have a RowHeight of 'fit' and a ColumnWidth that is resizable, such as '1x'.

For example, on a Windows 10, Intel Xeon CPU E5-1650 v4 @ 3.60 GHz test system, if you create 100 labels with wrapping text in a grid layout manager with fit height rows and resizable columns, and then resize the figure window by dragging the corner of the figure, the label text adjusts to fit the size of the figure almost immediately. In R2021a, there is a delay of about 2 seconds before the text adjusts.

f = uifigure;
g = uigridlayout(f);
g.ColumnWidth = {'1x'};
numrows = 100;
g.RowHeight = repmat({'fit'},numrows,1);
 
for row = 1:numrows
c = uilabel(g);
c.Text = ['Lorem ipsum dolor sit amet, consectetur adipiscing elit,' ...
' sed do eiusmod tempor incididunt ut labore et dolore magna aliqua.'];
c.WordWrap = 'on';
end
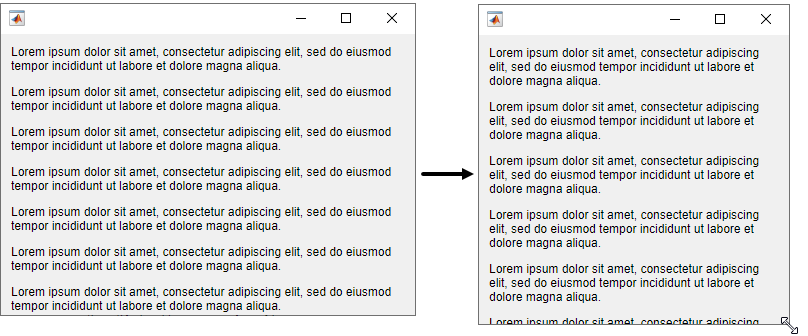
Two figure windows with labels with wrapping text. The right window is a resized version of the left window, where the wrapped label text takes up an additional row.

Live Editor: Improved performance when saving live scripts or functions

Saving live scripts and live functions in the Live Editor is faster in R2021b than in R2021a. The improvement is most noticeable when you save live functions with more than 1000 lines of code and live scripts with fewer than 100 lines of code.

For example, on a Windows 10, Intel Xeon E5-1650 CPU @ 3.60 GHz test system, saving an example live function containing 4000 lines of code takes approximately 2.05 seconds in R2021b. In R2021a, saving the same live function takes approximately 2.57 seconds.

Data Processing Dialog Boxes: Improved resizing performance

The Basic Fitting UI, Data Statistics UI, Colormap Editor, and Linked Plot Data Sources dialog now use uigridlayout to manage positions of UI components. This change results in a smoother experience when adjusting the size of these dialog boxes. For more information about the Data Statistics UI, see Computing with Descriptive Statistics.

For example, on a Windows 10, Intel Xeon E5-1650 CPU @ 3.60 GHz test system, when you increase the size of the Colormap Editor, the size changes smoothly.

Figure Interactions: Improved performance when using built-in axes interactions

Performance of figure interactions has been improved by coalescing built-in axes interactions so that there are significantly fewer interactions to process. These changes make interacting with a plot smoother and reduce the delay between an input and a response.

For example, on a Windows 10, Intel Xeon E5-1650 CPU @ 3.60 GHz test system, while panInteraction mode is active, when you click and drag the cursor within the axes the figure pans more quickly and tracks the cursor more closely.

UI Figures: Improved performance when displaying axes toolbar

The performance of the axes toolbar in UI figures has been improved to reduce the delay before the toolbar appears.

For example, on a Windows 10, Intel Xeon E5-1650 CPU @ 3.60 GHz test system, when you pause the cursor on the axes, the axes toolbar appears more quickly.

UI Figures: Improved performance when interacting with linked axes

Interacting with linked axes has improved performance when using figures created with the uifigure function or figures created in MATLAB Online™.

Software Development Tools

Projects: Collaborate using projects in MATLAB Online

Starting in R2021b, MATLAB Online provides support for basic projects workflows:

  • Create an empty project and add files and folders.

  • Clone a project from Git™.

  • Explore your project and run a dependency analysis.

  • Create a project and manage your project files programmatically.

Source Control: Work with files under Git in MATLAB Online

Starting in R2021b, MATLAB Online provides support for basic Git workflows:

  • Cloning a remote Git repository

  • Committing files to Git

  • Pulling, pushing, and fetching files with Git

Unit Testing Framework: Use the TestCase class template to create tests more quickly and accurately

You can now create a TestCase class, including basic test functionality, in MATLAB and MATLAB Online. To create a new test class, select New > Test Class on the Home, Editor, or Live Editor tabs.

Use the TestCase class template to create tests more conveniently. The template includes a TestClassSetup methods block, a TestMethodSetup methods block, and a Test methods block that defines a simple Test method. To customize your test class, add code to the file or remove unused code that is included by default. For more information about class-based tests, see Author Class-Based Unit Tests in MATLAB.

Unit Testing Framework: Run live-function-based tests interactively in MATLAB Online

Starting in R2021b, you can run live-function-based tests interactively in MATLAB Online. When you open an MLX file defining a function-based test in MATLAB Online, the toolstrip lets you run all tests in the file or just the current test.

To run tests and customize your test run interactively, use the Run Tests section in the Live Editor tab of the toolstrip. For more information, see Run Tests in Editor.

App Testing Framework: Perform press gestures on axes and UI axes with different selection types

The app testing framework now supports mouse selection types in press gestures that are performed on axes and UI axes. For example, create an axes with a plot and then test a double-click gesture at the point (3, 2).

f = uifigure;
ax = axes(f);
plot(ax,1:10)
tc = matlab.uitest.TestCase.forInteractiveUse;
tc.press(ax,[3 2],'SelectionType','open')

App Testing Framework: Perform drag gestures on axes and figures with different selection types

Starting in R2021b, the app testing framework supports drag gestures on UI figures. Additionally, when you test a drag gesture on an axes, UI axes, or UI figure, you can specify the mouse selection type. For example, create a figure and drag on it from the point (100, 200) to the point (200, 300) using a right-click gesture.

f = uifigure;
tc = matlab.uitest.TestCase.forInteractiveUse;
tc.drag(f,[100 200],[200 300],'SelectionType','alt')

App Testing Framework: Use any units of measurement in gestures at the center of components

Starting in R2021b, when you perform a gesture at the center of a component, the component or its parent containers can use any units of measurement. In previous releases, the framework does not support containers that use nonpixel units.

For example, create a figure and set its Units property to 'normalized'. Then, create a panel in the figure and press at the center of the panel.

f = uifigure;
f.Units = 'normalized';
p = uipanel(f);
tc = matlab.uitest.TestCase.forInteractiveUse;
tc.press(p)

If you perform a gesture at the center of a component using a syntax that accepts location as an input (for instance, press(testcase,comp,location)), then the figure or parent containers can use only 'pixels' as their units of measurement.

 Functionality being removed or changed

Specifying diagnostic after name-value arguments in qualifications is not recommended

Still runs

Starting in R2021b, when you test for equality using the verifyEqual, assumeEqual, assertEqual, or fatalAssertEqual methods, specifying name-value arguments before the diagnostic input argument is not recommended. Place name-value arguments after all of the positional arguments instead. Although not recommended, you still can specify diagnostic after the name-value arguments when these arguments use the name,value syntax.

The reason for this change is that, starting in R2021a, MATLAB supports a new syntax for passing name-value arguments. In the new syntax, the name and value arguments are connected by an equals sign (name=value), and the name is not enclosed in quotes. To use the new syntax with qualification methods, specify positional arguments, including diagnostic, before the name=value arguments. If you specify diagnostic after name=value arguments, MATLAB produces an error.

This table shows an example of how you can update your code.

R2021a and EarlierStarting in R2021b
testCase = matlab.unittest.TestCase.forInteractiveUse;
verifyEqual(testCase,1.5,2, ...
    "RelTol",0.1,"Difference must be within relative tolerance.")
assumeEqual(testCase,1,2, ...
    "AbsTol",0.5,"Difference must be within absolute tolerance.")
testCase = matlab.unittest.TestCase.forInteractiveUse;
verifyEqual(testCase,1.5,2, ...
    "Difference must be within relative tolerance.",RelTol=0.1)
assumeEqual(testCase,1,2, ...
    "Difference must be within absolute tolerance.",AbsTol=0.5)

For more information, see verifyEqual.

matlab.unittest.TestSuite.fromProject ignores the files that do not define test procedures when creating a test suite

Behavior change

Starting in R2021b, if your project includes files with the Test classification, matlab.unittest.TestSuite.fromProject ignores the files that do not define test procedures when you create a test suite. For example, if an abstract TestCase class definition file is labeled with the Test classification, fromProject ignores it. In previous releases, MATLAB produces an error if fromProject is called on a project that uses the Test classification for any files other than concrete test files. With this change, fromProject becomes consistent with the matlab.unittest.TestSuite.fromFolder method: both methods create a test suite from all the concrete test files and ignore any other files in the folder.

This behavior change also applies to the testsuite, runtests, and runperf functions when they operate on code organized into files and folders within a project.

Test suites created from projects cannot run without the Java Virtual Machine (JVM) software

Behavior change

Starting in R2021b, if you start MATLAB without the Java® Virtual Machine (JVM®) software and create a suite from the test files in a project using testsuite, the function uses the matlab.unittest.TestSuite.fromProject method to create the suite. If you then try to run the test suite without the JVM software, MATLAB produces an error because the project cannot be opened without the JVM software. In previous releases, when MATLAB runs without the JVM software, testsuite uses matlab.unittest.TestSuite.fromFolder to create a suite from the test files in the project, and the testing framework runs the resulting test suite.

This behavior change also applies to the runtests and runperf functions when they operate on code organized into files and folders within a project.

External Language Interfaces

C++ interface: Support for C++ language features

The C++ interface supports these additional C++ language features.

Support for void** parameters

MATLAB returns a void* argument for void** parameters. For more information, see void** Input Argument Types. For information about memory management of void** parameters, see Pass Ownership of Memory to MATLAB.

char [] parameters behave like char * parameters

MATLAB supports char[] parameters as either integer or character (string), the same as char* parameters. Likewise, the Unicode® types wchar_t[], char16_t[], and char32_t[] behave like wchar_t*, char16_t*, and char32_t*. For more information, see C++ char* and char[] Types.

Support for static data members

Public static and public const static data members are treated as read-only properties in MATLAB. You cannot modify the value of a C++ static data member in MATLAB. For more information, see Static Data Members.

You can use a public static data member (property) as the data type of an input argument or return type in a class constructor, method, or function. You also can use a static property or method to define the shape of an argument. For information about using static properties to define the shape, see Use Property or Method as SHAPE.

C++ interface: Publisher options

The C++ interface supports these build configuration features.

Overwrite existing library definition files

Publishers can automatically overwrite existing library definition MLX files when calling clibgen.generateLibraryDefinition. Set the OverwriteExistingDefinitionFiles name-value argument to true. This option is useful when you create and modify the definition file for a library libname.

When you use this option, MATLAB deletes definelibname.mlx and definelibname.m, including any edits you made to the files.

Options for defining arguments

Java interface: Specify JRE path for MATLAB

You can run MATLAB with your system version of the Java Runtime Environment (JRE™). For information about Java versions compatible with MATLAB, see MATLAB Interfaces to Other Languages.

To set the JRE path in MATLAB, call jenv. You must restart MATLAB to use the updated path. This command sets the path for all future MATLAB sessions but does not change the path for other applications on your computer.

Alternatively, you can set the path from the operating system prompt. Call matlab_jenv, then start MATLAB.

Java: Call into MATLAB from a Java program called by MATLAB

Java developers can use the com.mathworks.engine.MatlabEngine API getCurrentMatlab method to call back into MATLAB from Java. Incorporating this method in your application allows MATLAB users to call functionality from your Java program.

For information about developing these Java programs, see Call Back into MATLAB from Java.

Python interface: Run Python commands and scripts from MATLAB

The pyrun and pyrunfile functions let you call Python® commands and scripts from MATLAB. For more information, see Directly Call Python Functionality from MATLAB

Python: Support for complex multidimensional arrays

MATLAB supports passing complex multidimensional array data to Python and from Python to MATLAB, for both in-process and out-of-process execution modes.​ For example, create a file test.py containing this code:

def returnData(data):
   return data

To pass a complex MATLAB array to returnData, type:

mc = complex(magic(3));
c = py.test.returnData(mc)
c = 
  Python memoryview:

   8.0000 + 0.0000i   1.0000 + 0.0000i   6.0000 + 0.0000i
   3.0000 + 0.0000i   5.0000 + 0.0000i   7.0000 + 0.0000i
   4.0000 + 0.0000i   9.0000 + 0.0000i   2.0000 + 0.0000i

    Use details function to view the properties of the Python object.

    Use double function to convert to a MATLAB array.

To convert the return value to a MATLAB array, type:

C = double(c)
C = 3×3 complex    
   8.0000 + 0.0000i   1.0000 + 0.0000i   6.0000 + 0.0000i
   3.0000 + 0.0000i   5.0000 + 0.0000i   7.0000 + 0.0000i
   4.0000 + 0.0000i   9.0000 + 0.0000i   2.0000 + 0.0000i

For information about MATLAB to Python data type mapping, see Pass Matrices and Multidimensional Arrays to Python.

Python: Version 3.9 support

MATLAB now supports CPython 3.9, in addition to existing support for 2.7, 3.7, and 3.8. For more information, see Versions of Python Compatible with MATLAB Products by Release

 WSDL Web Services Documents: Apache CXF version 3.4.2 support

MATLAB supports Apache CXF version 3.4.2 for use with WSDL Web services. For more information, see Set Up WSDL Tools.

 Compatibility Considerations

Download the latest version 3.4.2 release of the Apache CXF tool from https://cxf.apache.org/download.

 Perl 5.32.1: MATLAB support on Windows

As of R2021b, MATLAB on Windows ships with an updated version of Perl, version 5.32.1. See https://www.perl.org for a standard distribution of Perl, Perl source code, and information about using Perl.

 Compatibility Considerations

If you use the perl command on Windows platforms, see https://www.perl.org for information about using this version of the Perl programming language.

 Functionality being removed or changed

name=value syntax errors for calls to Python functions using py. prefix

Behavior change

Starting in R2021b, MATLAB errors when you use name=value syntax for passing keyword arguments to Python functions using the py. prefix. In R2021a, MATLAB might silently give the wrong answer. Use pyargs to pass keyword arguments.

For example, the Python print function has a keyword argument sep. This Python statement sets the sep argument to a comma followed by a space:

print('comma','separated','values',sep=', ')

When you call this statement in MATLAB, MATLAB interprets sep=', ' as a name=value argument:

py.print('comma','separated','values',sep=', ')
R2021a BehaviorR2021b BehaviorHow to Update Your Code

py.print(...
    'comma','separated','values',...
    sep=', ')
Silent wrong answer:
comma separated values sep , 

py.print(...
    'comma','separated','values',...
    sep=', ')
Error:
Error using py.print 
Using name=value format is not supported. 
Use pyargs to pass keyword arguments

py.print(...
    'comma','separated','values',...
    pyargs(sep=', '))
comma, separated, values

createSoapMessage, callSoapService, and parseSoapResponse have been removed

Errors

Consider using matlab.wsdl.createWSDLClient instead of the createSoapMessage, callSoapService, and parseSoapResponse functions to communicate with Web services using Simple Object Access Protocol (SOAP). There is no direct function replacement for the SOAP functions, but when you create a WSDL interface, you have access to the Web service functionality.

createClassFromWsdl has been removed

Errors

The matlab.wsdl.createWSDLClient function replaces the createClassFromWsdl function to communicate with Web services from MATLAB using Web Services Description Language (WSDL). matlab.wsdl.createWSDLClient enables you to specify additional information needed to access the WSDL document. For more information, see weboptions.

To get started using matlab.wsdl.createWSDLClient, follow these steps.

  1. Download supported versions of the Java JDK™ and Apache CXF programs. For more information, see Set Up WSDL Tools.

  2. Set the paths to these programs, where jdk is the path to the JDK installation and cxf is the path to the CXF program.

    matlab.wsdl.setWSDLToolPath('JDK',jdk,'CXF',cxf)

To update your code, replace calls to createClassFromWsdl with calls to matlab.wsdl.createWSDLClient. For example, for a Web service with this URL:

url = 'https://examplesite.com/samplewebservice';

replace this call to createClassFromWsdl:

createClassFromWsdl(strcat(url,'?WSDL'))

with:

matlab.wsdl.createWSDLClient(url)

Note

matlab.wsdl.createWSDLClient does not support RPC-encoded WSDL documents.

Hardware Support

Connect and Control Arduino board using the Arduino Explorer App

The MATLAB Support Package for Arduino® Hardware now has an Arduino Explorer app.

Using this app, you can:

  • Set up the Arduino board

  • Connect to an Arduino board over USB, Bluetooth®, and WiFi

  • Configure, read from, and write to Arduino pins

  • Visualize data from Arduino pins

  • Record and save data from Arduino pins to the MATLAB workspace

  • Analyze the recorded data

  • Generate equivalent MATLAB code

Read data from APDS9960 sensor connected to the Arduino hardware

The MATLAB Support Package for Arduino Hardware enables you to read gesture, proximity, clear light and color (RGB) data from APDS9960 sensor connected to Arduino hardware.

Support for CAN shields on Raspberry Pi Hardware

Use the Raspberry Pi® Blockset to read and write CAN messages from the CAN network on the Raspberry Pi hardware.