Environment
Help Center: View documentation in your system web browser
When you access the documentation from an installed version of MATLAB®, the documentation now opens in your system web browser. Previously, the documentation opened in the Help browser. This change applies whether you view the web documentation or the documentation installed locally on your system. For more information about installing documentation for offline use, see Install Documentation (R2024b).
As part of this change, the Help browser has been removed. In addition, installed products are no longer indicated in the documentation. To copy an example and supporting files onto your system and open the example in MATLAB, click the Copy Command button next to the example in the documentation. Then, paste the copied command into the MATLAB Command Window. You also can open some examples directly in your web browser in MATLAB Online™.
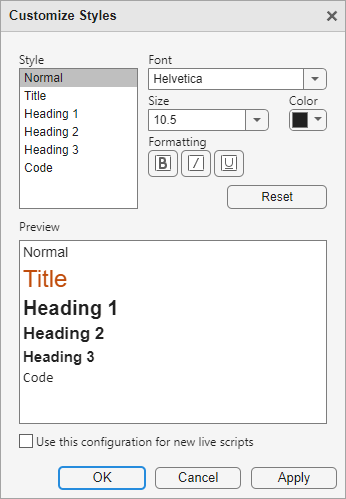
Live Editor Fonts: Customize font, size, color, and formatting of text and code styles
You can customize the font, size, color, and formatting of text and code styles in the Live Editor using the Customize Styles dialog box. To customize a text or code style, go to the Live Editor tab, and in the Text section, click the Customize styles button . Then, select the style that you want to customize and change the font, size, color, and formatting for the selected style. The Customize Styles dialog box shows a preview of each style.
The customized style applies only to the current document. To apply the customized style to all new live scripts as well, select the Use this configuration for new live scripts option.
For more information, see Format Text in the Live Editor (R2024b).
Live Editor Controls: Add range sliders to live scripts
Add a range slider to your live script to select a range interactively. To add a range slider, go to the Live Editor tab, and in the Code section, select Control > Range Slider.
![]()
For more information, see Add Interactive Controls to a Live Script (R2024b).
Live Editor Controls: Populate drop-down list items using additional variable types
You can now populate the items in a drop-down list using values stored in a categorical array, character array, cell array, or double array. Previously, only string arrays were supported.
You also can now edit the item labels after populating the items in a drop-down list using the values stored in a variable. Previously, the item labels were read-only.
For more information, see Link Variables to Controls (R2024b).
Live Editor Controls: Restore default values for all controls
You can restore the default values for all controls in a live script. To restore the default values for all controls, right-click any control in the live script and select Restore Default Values for All Controls.
For more information, see Specify Default Values (R2024b).
help Function: Get updated help text for functions, methods, and
classes
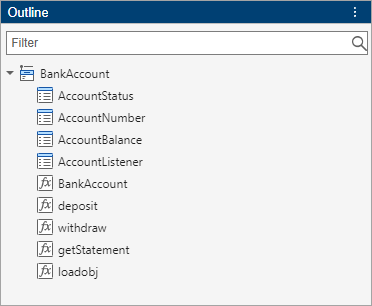
Editor in MATLAB Online: View outline of your code using Outline panel
In the MATLAB Online Editor, you can use the Outline panel to view a high-level outline of scripts, functions, and classes. To view an outline of a file open in the Editor, go to the View tab, and in the Tools section, click Outline. To navigate to an area within your code file, double-click the related entry in the Outline panel.
For more information, see Edit and Format Code (R2024b).
Editor TLC Support in MATLAB Online: View and edit TLC files with syntax highlighting and automatic indenting while typing
In MATLAB Online, the Editor displays Target Language Compiler (TLC) files with syntax highlighting for commands, comments, macros, and strings. In addition, the Editor automatically indents lines of code in TLC files while you type.
In MATLAB
Online, you also can use preferences to configure how the Editor displays TLC files.
On the Home tab, in the Environment section,
click ![]() Preferences. Select MATLAB > Editor/Debugger > Other Languages > TLC, and adjust the options as needed.
Preferences. Select MATLAB > Editor/Debugger > Other Languages > TLC, and adjust the options as needed.
Add-Ons in MATLAB Online: Update add-ons directly from Add-Ons panel
In MATLAB Online, you can update add-ons directly from the Add-Ons panel. To update an add-on, in the Installed section of the Add-Ons panel, click the Update button to the right of the add-on. The Add-Ons panel displays the Update button next to add-ons that have an update available.
To open the Add-Ons panel if it is not open, click the Add-Ons button
![]() in the sidebar on the left side of the MATLAB
Online desktop. Alternatively, go to the Home tab, and in the
Environment section, select Add-Ons > Add-Ons.
in the sidebar on the left side of the MATLAB
Online desktop. Alternatively, go to the Home tab, and in the
Environment section, select Add-Ons > Add-Ons.
For more information, see Get and Manage Add-Ons (R2024b).
Find Files in MATLAB Online: Manage list of search results and export as plain text
When searching using the Find Files panel in MATLAB
Online, you can collapse or clear the list of search results. To collapse or clear
the list of search results, click the Find Files actions button
(![]() ) at the top of the Find Files panel and select
Collapse Results or Clear Results.
) at the top of the Find Files panel and select
Collapse Results or Clear Results.
You also can export the list of search results as a plain text file
(.txt) that can be viewed in an external text editor. To export the
list, click the Find Files actions button (![]() ) and select Export as Plain
Text.
) and select Export as Plain
Text.
For more information, see Advanced Search in MATLAB Online (R2024b).
New Desktop for MATLAB (Beta): Try new features including dark theme, an updated layout, and expanded search capabilities
The new desktop for MATLAB includes new and updated features, such as:
Dark theme support for the desktop, plots, and apps
An updated layout
Expanded search capabilities
A new figure window experience with a toolstrip, integrated side panels, and a new tabbed container
A new plain text file format for live scripts
A new Debugger panel and Source Control panel
Enhanced workflows for MATLAB projects
Improved screen reader support
Extension points
To try these new features, download the New Desktop for MATLAB (Beta) on File Exchange. For more information about these new features, see Get Started with the New Desktop for MATLAB (Beta) (R2024b).
Note
The new desktop for MATLAB is in beta development and should not be used for development or production activities. Report all feedback and issues directly to the development teams by using the Feedback button directly above the MATLAB Toolstrip.
New Desktop for MATLAB (Beta): Try new features including dark theme, an updated layout, and expanded search capabilities
Functionality being removed or changed
File version history in MATLAB Online is no longer supported
Behavior change
Restoring previous versions of a file in MATLAB Online is no longer supported. Previously, you could view the file version history and restore a previous version of a file by selecting it in the File Versions tab.
demo function no longer supports full product names
Behavior change
When you use the demo (R2024b) function to open examples for
products other than MATLAB and Simulink®, full product names are no longer supported. You must use the product
short name instead.
For example, to open the examples for Computer Vision Toolbox™, use the command demo toolbox vision.
publish function will not longer support
"entireFigureWindow" value for
figureSnapMethod name-value argument
Still runs
For the publish (R2024b) function, specifying the
figureSnapMethod name-value argument as
"entireFigureWindow" will not be supported in a future release.
Use the "entireGUIWindow", "print", or
"getframe" values instead.
Language and Programming
dbstop Function: Find missing semicolons by pausing execution on
unsuppressed output
When debugging, you can use dbstop (R2024b) to pause execution when unsuppressed
output is displayed because the line of code is not suppressed by a semicolon
(;). Outputs that are displayed for other reasons, such as from
disp or fprintf, do not stop execution.
Error Messages: Error text now indicates specific location in code
When possible, MATLAB adds caret symbols (^) in error messages beneath the code
that led to the error. For example, calling the function
getNumPermutations with a value of r greater than
n causes an error in the second call to factorial.
That second call is now specifically highlighted with carets in the error message.
function numPerms = getNumPermutations(n,r)
    numPerms = factorial(n)/factorial(n - r);
end
x = getNumPermutations(2,3)
Error using factorial (line 20)
N must be an array of real non-negative integers.

Error in getNumPermutations (line 2)
    numPerms = factorial(n)/factorial(n - r);
                            ^^^^^^^^^^^^^^^^
MATLAB also uses caret symbols to highlight inputs that fail argument validation in
functions and class methods. For example, both the Height and
Width input arguments for the function
rectangleArea must be positive. The error message highlights which
input does not pass validation.
function area = rectangleArea(Height,Width)
    arguments (Input)
        Height (1,1) {mustBePositive}
        Width (1,1) {mustBePositive}
    end
    area = Height*Width;
end
a = rectangleArea(5,4-7)
Error using rectangleArea (line 4)
 a = rectangleArea(5,4-7)
                     ^^^
Invalid argument at position 2. Value must be positive.
Debugging in MATLAB Online: View error breakpoint messages in Debugger panel
When the Pause on Errors or Pause on Warnings breakpoints are enabled and an error or warning occurs, the Debugger panel displays the resulting message and the location at which MATLAB is paused.
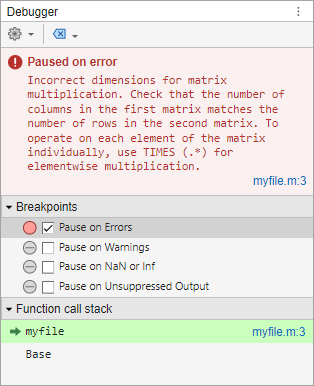
For more information about these error breakpoints, see Set Breakpoints (R2024b).
matlab.lang.obfuscateNames Function: Obfuscate names of local
variables, local functions, and nested functions
Use the matlab.lang.obfuscateNames (R2024b) function to obfuscate the names of local
variables, local functions, and nested functions in MATLAB source code. While the commands pcode -R2022a and
mcc -j provide obfuscation using P-code files, this
matlab.lang.obfuscateNames function provides advanced obfuscation
options.
MATLAB Vault: Access and identify existing MATLAB secrets in parallel environments
In parallel environments, you can access and identify existing secrets from your
MATLAB vault using getSecret (R2024b),
getSecretMetadata (R2024b), and isSecret (R2024b).
Creating, removing, and listing secrets in parallel environments is not supported.
Validation Functions: Validate arguments with matrix and vector shapes
Use the mustBeMatrix (R2024b),
mustBeRow (R2024b),
and mustBeColumn (R2024b)
validation functions to enforce the dimensionality of an argument to be 2-D, a 1-by-N row
vector, or an M-by-1 column vector, respectively. These functions extend the existing
checks mustBeVector (R2024b)
and mustBeScalarOrEmpty (R2024b) for robust size checking in argument and property
validation.
For more information, see Function Argument Validation (R2024b).
Handle Objects: Define weak references for handle objects
A weak reference to a handle object works much like a regular handle, but a weak reference does not prevent the object it references from being deleted. In other words, if an object is only referred to by weak references, MATLAB automatically deletes the object. Using weak references in applications like caches or data structures with back pointers can help simplify object cleanup.
You can use the WeakHandle property attribute to define a weak
reference to the value of a property. You can also use the class matlab.lang.WeakReference (R2024b) to construct weak references to existing handle
objects. For an overview and examples of the functionality, see Weak Reference Handles (R2024b).
Object Serialization: Customize how objects are serialized and deserialized
Three new classes provide you with more control over customizing the serialization (saving) and deserialization (loading) processes:
matlab.mixin.CustomElementSerialization(R2024b) — Inherit from this class and implement its methods to control how an object is serialized, deserialized, or both.matlab.serialization.ElementSerializationContent(R2024b) — Use the methods of this class to add, rename, remove, or change the values of the properties of the object being serialized or deserialized.matlab.serialization.SerializationContext(R2024b) — Use this class to determine whether to customize serialization and deserialization based on whether the object will be stored in a human readable form, like objects serialized with the MATLAB Data API for C++.
Use these classes to preserve forward and backward compatibility for classes that you
update over time. These classes add an extra level of control over serialization and
deserialization beyond what the existing saveobj and
loadobj methods provide. saveobj and
loadobj will continue to work, but they cannot be combined with the new
CustomElementSerialization mixin.
matlab.codeanalysis.validateConfiguration Function: View severity of
issues in configuration file
The issues table returned by the matlab.codeanalysis.validateConfiguration (R2024b) function includes a column named
Severity that shows the severity of an issue, specified as
error, warning, or info.
The ErrorMessage and ErrorID columns have been
renamed to Message and MessageID,
respectively.
typecast Function: Convert data types using
"like" syntax, and pass logical, character vector, and complex
inputs
You can use the syntax typecast(X,"like",p) to convert the bit
patterns of X to the same data type and complexity (real or complex) as
the prototype p. You can also convert from and to logical or character
vector data types, as well as complex numeric types. For more information, see typecast (R2024b).
matlab.indexing.isScalarClass Function: Identify scalar
classes
Use the matlab.indexing.isScalarClass (R2024b) function to identify scalar classes. The
function returns true when its input is a function handle or an instance
of a class that inherits from matlab.mixin.Scalar.
Class Diagram Viewer: Import classes from MATLAB packages
The Class Diagram
Viewer (R2024b) app and the matlab.diagram.ClassViewer (R2024b) command-line API can import classes from MATLAB packages. For more information on packages, see Organize and Distribute Code Using MATLAB Package Manager (R2024b).
Functionality being removed or changed
mlintrpt function has been removed
Errors
The mlintrpt (R2024b) function has been removed. Use
the Code Analyzer (R2024b)
app instead to generate a report of code issues for a selected file or folder and its
subfolders.
Class definition updates after path changes
Behavior change
When a new class definition is added to the path and it takes precedence over an old definition of the same name, MATLAB uses the new definition. MATLAB updates existing instances of the class the next time those instances are accessed. For more details, see Changing the Path to Update Class Definitions (R2024b).
In previous releases, MATLAB immediately updated class definitions when the new definition was in a class folder (@-folder), but for classes defined in path folders, you had to clear the old definition before MATLAB recognized the new definition.
Default display for sparse matrices includes additional information
Behavior change
The default display for sparse matrices with double values now
explicitly identifies the matrices as sparse. The display also now includes the
dimensions, class, and number of nonzero entries in the matrix. For example:
A = [0 0 0 5; 0 2 0 0; 1 3 0 0; 0 0 4 0];
sparse(A)
ans =

  4×4 sparse double matrix (5 nonzeros)

   (3,1)        1
   (2,2)        2
   (3,2)        3
   (4,3)        4
   (1,4)        5
The default display for sparse matrices with logical values already
identified the matrices as sparse and included the dimensions and class, but the display
now also includes the number of nonzero entries.
Implicit default value for properties whose class is a subclass of
matlab.mixin.Scalar
Behavior change
For properties whose class is a subclass of matlab.mixin.Scalar,
MATLAB now creates an implicit default value by calling the no-argument
constructor of the class. For example, if MyScalarClass is a subclass of
matlab.mixin.Scalar, MATLAB calls the no-argument constructor of MyScalarClass to
assign a default value to Prop1 in TestClass.
classdef TestClass
    properties
        Prop1 MyScalarClass
    end
end
Define an explicit default value for Prop1 if your class
requires different behavior.
Implicit default value for properties whose class is an enumeration based on numeric or logical values
Warns
When MATLAB assigns a default value to a property whose class is an enumeration based
on numeric or logical values, it currently uses the zero-based enumeration member if
such a member exists. MATLAB chooses the zero-based member even if that member is not listed first in
the enumeration definition. For example, in the class MyContainer, the
default value of Prop1 is MyZero in
R2024b.
classdef MyContainer
    properties
        Prop1 (1,1) MyEnum
    end
end
classdef MyEnum < uint8
    enumeration
        MyFirst (1)
        MyZero (0)
        MySecond (2)
        MyThird (3)
    end
end
In a future release, MATLAB will instead use the first listed enumeration member as
the default, regardless of its underlying numeric value. In the case of
MyContainer, the default value of Prop1 will be
MyFirst. To avoid a warning in R2024b and a future change in
behavior, assign MyEnum.MyZero as the default value for
Prop1.
classdef MyContainer
    properties
        Prop1 (1,1) MyEnum = MyEnum.MyZero
    end
end
Defining classes: Using function syntax to define classes will
not be supported in a future release
Still runs
Support for defining classes using function syntax will be removed
in a future release. With appropriate code changes, replace existing function-based
classes with classes defined using the classdef keyword.
Defining classes: Using schema.m will not be supported in a
future release
Still runs
Support for classes defined using schema.m files will be removed
in a future release. Replace existing schema-based classes with classes defined using
the classdef keyword.
whos Function: Improved accuracy of array size
information
Behavior change
The whos (R2024b) function returns a more accurate
array size measurement in the Bytes column of the displayed list and
in the bytes field of the output structure.
Data Analysis
summary Function: Summarize array data and configure summary
contents
The summary (R2024b) function can now display or return
in a scalar structure a summary of array data, including numeric,
logical, datetime, duration,
and calendarDuration types. Previously, the function supported array
data only when it was categorical.
You can configure the summary contents using one or more name-value arguments:
Statistics— Specify which statistics to compute.Detail— For table or timetable data only, specify the level of table metadata detail to display in the summary.DataVariables— For table or timetable data only, specify the variables to summarize.
When you display a summary of a categorical array, the summary now always includes the number of undefined elements. Previously, the summary omitted the number of undefined elements if the array contained no missing values.
If you want to omit the number of undefined elements from the summary, specify the
Statistics name-value argument. For example,
summary(A,Statistics="counts") displays only the number of
elements in each category.
isbetween Function: Specify numeric, nonnumeric, or tabular input
data
Determine which elements are within a specified range using the isbetween (R2024b) function for any array, table, or timetable input data.
Previously, supported only date and time input
data.
For data in a table or timetable, you can return a table or timetable containing logical
values instead of a logical array by using the OutputFormat name-value
argument. You can also specify tabular variables to operate on by using the
DataVariables name-value argument.
rmmissing and rmoutliers Functions: Define
locations of missing entries or outliers using array or table
Define the locations of missing entries or outliers using a vector, matrix, table, or
timetable. Specify the MissingLocations name-value argument of the
rmmissing (R2024b) function or the
OutlierLocations name-value argument of the rmoutliers (R2024b)
function.
Previously, rmmissing did not support
MissingLocations, and rmoutliers supported
specifying OutlierLocations only as a vector or matrix.
Clean Outlier Data Live Editor Task and Data Cleaner App: Define outliers using range or workspace variable
In the Clean Outlier
Data (R2024b) task and the Clean Outlier Data cleaning
method in the Data Cleaner (R2024b) app,
you can now detect outliers as elements outside of a range specified by an upper and lower
threshold. Select the Range detection method.
In the Clean Outlier Data task, you can also define
outliers using a logical workspace variable, where elements with a value of
1 (true) correspond to outliers. Select the
Workspace variable detection method.
Experiment Manager: Improved interface for experiment setup and result analysis
In the Experiment Manager (R2024b) app, you can set up your experiment using an improved interface.
Create an initialization function that configures data or other experiment details before initiating the trial runs to reduce trial runtime. Previously, setup code was rerun for each trial.
Incorporate a suggested parameter for your experiment for some preconfigured experiment templates, such as the template that supports solving ordinary differential equations.
You can also efficiently analyze experiment results.
Your experiment function for a general purpose experiment can return an output containing multiple data types.
When an experiment runs using the sequential execution mode, you can stop or cancel the experiment. Clicking the Stop button finishes the current trial and ends experiment execution. Clicking the Cancel button immediately ends experiment execution.
When you select a trial in the results table, you can export the selected trial row to the MATLAB workspace as a table.
timeseries2timetable Function: Convert events associated with
timeseries objects to an event table associated with a
timetable
You can convert timeseries objects that have events to a timetable that
has an event table by using the timeseries2timetable (R2024b) function. When
timeseries2timetable converts timeseries objects
to a timetable, it also converts all associated tsdata.event event objects
to an event table. Then the function attaches the event table to the timetable.
Before R2024b, timeseries2timetable ignored events when converting
timeseries objects to a timetable.
Retime Timetable and Synchronize Timetables Live Editor Tasks: Specify custom function as local function or function handle
In the Retime
Timetable (R2024b) and Synchronize
Timetables (R2024b) Live Editor tasks, when you select the Custom
function option for the General rule method, you can
either select a locally defined function or specify a function handle.
To select a local function:
Select
Custom function.Select
Local functionfrom the next menu.If you want to add a new local function to the script, click New. The task generates template code for a custom aggregation function within the live script. To customize this code, edit it in the live script.
Select the name of the local function from the
selectmenu.
To specify a function handle:
Select
Custom function.Select
Function handlefrom the next menu.Specify a function handle in the text box.
You can specify a handle to a MATLAB function or write an anonymous function in the text box. For example, to specify
meanas the function, type@meanin the text box.
Variables Editor in MATLAB Online: View variables with enhanced readability
Variables in the Variables editor in MATLAB Online have enhanced readability. The updated display has a streamlined look, including a simplified, borderless design and row striping for easier data review and analysis.

Variables Editor in MATLAB Online: View variables with enhanced readability
Functionality being removed or changed
min and max functions no longer support
specifying second input array as character array
Errors
The min (R2024b) and max (R2024b) functions now return an error if you specify the second input array
as a character array. This change minimizes confusion with options that can be specified
as character vectors, such as the missing value condition. To maintain the previous
functionality, you can convert the second input array to double, for
example, max(A,double(B),"includenan").
Data Import and Export
Reading Online Data: Read remote data over HTTP and HTTPS using file operation, low-level I/O, datastore, video, and HDF5 functions
In addition to the existing support for reading remote data, you can now use the
following functions to read data from primary online sources through an internet URL.
Specify a filename that contains the protocol http:// or
https://.
File operation functions:
isfile(R2024b),dir(R2024b),copyfile(R2024b), andexist(R2024b)Low-level I/O functions:
fopen(R2024b),fread(R2024b),fgets(R2024b),fgetl(R2024b),feof(R2024b),fclose(R2024b),ferror(R2024b),fseek(R2024b),ftell(R2024b),fscanf(R2024b),frewind(R2024b), andfileread(R2024b)Datastore functions:
datastore(R2024b),tabularTextDatastore(R2024b),spreadsheetDatastore(R2024b),imageDatastore(R2024b),parquetDatastore(R2024b), andfileDatastore(R2024b)Video function:
VideoReader(R2024b)HDF5 functions:
h5disp(R2024b),h5info(R2024b),h5read(R2024b),h5readatt(R2024b),H5F.open(R2024b), andH5F.is_hdf5(R2024b)
JSON: Read and write dictionaries in JSON files
You can read and write dictionaries in JSON files using the readdictionary (R2024b) and writedictionary (R2024b) functions.
Parquet: Import Parquet MAP data
You can read the Parquet MAP data type using parquetread (R2024b). The function imports Parquet MAP data as
cell arrays in which each cell is a table. Each table has two variables,
Key and Value.
Symbolic Links: Create and use symbolic links to manipulate files and folders
You can create and identify symbolic links using the createSymbolicLink (R2024b) and isSymbolicLink (R2024b) functions. Symbolic links allow you to refer to data in
alternative locations.
You can delete, copy, and move files and folders using symbolic links. The deletion of a
symbolic link has no effect on the target file, folder, or symbolic link. Use the
ResolveSymbolicLinks name-value argument with the delete (R2024b) and rmdir (R2024b) functions, the
CopyLinkBehavior name-value argument with the copyfile (R2024b) function, and the MoveLinkBehavior name-value
argument with the movefile (R2024b) function.
Spreadsheet Files: Specify how to read merged cells from spreadsheets
You can specify how to read merged cells from spreadsheets using the
MergedCellColumnRule and MergedCellRowRule
name-value arguments with these functions:
readtable(R2024b)readtimetable(R2024b)readmatrix(R2024b)readcell(R2024b)readvars(R2024b)detectImportOptions(R2024b)
For example, you can specify to place the data from merged cells in the leftmost or rightmost cell, duplicate data in all merged cells, omit rows or columns with merged data, or return an error.
Image Files: Automatically orient JPEG and TIFF images
If a JPEG or TIFF image file includes an Exif Orientation tag, you
can automatically orient the image when reading it into MATLAB. Specify the AutoOrient name-value argument as
true when you call the imread (R2024b) function.
The output structure of the imfinfo (R2024b) function includes
AutoOrientedWidth and AutoOrientedHeight fields.
These fields describe the width and height of the image data after the transformations
specified by the Exif Orientation tag in the image file have been
applied.
sonify Function: Convert numeric data to sound
The sonify (R2024b)
function converts numeric data to sound using a frequency-based method and provides
immediate playback capabilities. You can specify sonification parameters, such as frequency
range, immediate playback control, and playback duration.
VideoReader Object: Read remotely stored video files
You can now read video files stored in remote locations, such as Amazon S3™, Windows Azure® Blob Storage, and HDFS™, using the VideoReader (R2024b) object. The
VideoReader object, however, does not support reading Motion JPEG
2000 (.mj2) files from a remote location.
FTP: Enable TLS when connecting to FTP servers
When you connect to an FTP server using the ftp (R2024b) function, you can enable Transport Layer Security (TLS) using the
TLSMode name-value argument.
SFTP: Connect to servers that require passphrases or certificates
You can connect to servers with passphrases and certificates by using the
PrivateKeyPassphrase and CertificateFilename
name-value arguments, respectively, with the sftp (R2024b)
function.
HDF5 Interface: Use SZIP filter to read and write compressed datasets
You can write HDF5 datasets using SZIP compression. You can also read HDF5 datasets that have been compressed using SZIP compression.
In the high-level interface, use the SZIPEncodingMethod (R2024b) name-value argument of the h5create (R2024b) function to specify one of two methods for SZIP encoding.
Optionally, if you specify SZIPEncodingMethod, you also can use the
SZIPPixelsPerBlock (R2024b) name-value argument to specify the number of pixels (HDF5
data elements) per block.
In the low-level interface, use the H5P.set_szip (R2024b)
function to specify SZIP compression when creating a new dataset.
These low-level functions accept the value "H5Z_FILTER_SZIP" for the
filter input argument:
H5P.get_filter_by_id(R2024b)H5P.modify_filter(R2024b)H5P.remove_filter(R2024b)H5P.set_filter(R2024b)H5Z.get_filter_info(R2024b)
The H5Z.filter_avail (R2024b) function returns 1
(true) for the "H5Z_FILTER_SZIP" filter
identifier.
HDF5 Interface: Work with file integrity checks (R2024b Update)
In the low-level HDF5 interface, you can enable and suppress file integrity checks using
the H5P.set_relax_file_integrity_checks (R2024b) function. You can query the status of
file integrity checks using the H5P.get_relax_file_integrity_checks (R2024b) function.
Starting in R2024b, file integrity checks are enabled by default. For compatibility considerations, see HDF5 file integrity checks are enabled by default (R2024b Update).
HDF Vgroup Interface: Define longer vgroup names and vgroup class names
In the HDF Vgroup (V) interface, you can define names of arbitrary length for vgroups
and vgroup classes. For more information about the Vgroup interface, see hdfv (R2024b).
Scientific File Format Libraries: HDF5 library upgraded to version 1.14.4.3 (R2024b Update)
The HDF5 library is upgraded to version 1.14.4.3.
Functionality being removed or changed
Version 7.3 MAT files that contain variables of certain data types have decreased performance (R2024b Update)
Starting in R2024b, Version 7.3 MAT files use a newer version of the HDF5 library.
This change causes decreased performance for some Version 7.3 MAT files that contain
variables of any nonnumeric MATLAB data type besides char or logical.
Functions that read from or write to MAT files, such as the load (R2024b), save (R2024b), and matfile (R2024b) functions, take up to twice as long to execute when called with
Version 7.3 MAT files that contain variables of these data types.
HDF5 file integrity checks are enabled by default (R2024b Update)
Behavior change
Starting in R2024b, file integrity checks are enabled by default in the MATLAB HDF5 interface. When these checks are enabled, they fail for HDF5 datasets and attributes that contain a datatype that satisfies these two conditions:
The size of the datatype is at least 2 bytes.
The precision of the datatype is less than half of the size of the datatype.
As a result, the behavior of these high-level HDF5 functions has changed:
The
h5read(R2024b),h5readatt(R2024b), andh5writeatt(R2024b) functions now issue errors for datasets and attributes that fail file integrity checks. Previously, these functions did not issue errors for such datasets or attributes. To read data or read or write attributes in such situations, use theH5P.set_relax_file_integrity_checks(R2024b) function and the low-level HDF5 interface.The
h5disp(R2024b) andh5info(R2024b) functions now issue warnings for datasets and attributes that fail file integrity checks. These functions omit information about such datasets and attributes from their outputs. Previously, these functions did not issue warnings in this situation and included information about those datasets and attributes in their outputs. The warnings take this form:You can suppress file integrity checks in the low-level HDF5 interface using theWarning: Unable to read 'datasetName' from the file. A portion of the file may be corrupt.
H5P.set_relax_file_integrity_checks(R2024b) function, but not in the high-level HDF5 interface. This table shows how to update your code to use the low-level HDF5 interface.
| R2024a and Earlier | Starting in R2024b |
|---|---|
myData = h5read("myFilename.h5","myDatasetName");
|
fapl = H5P.create("H5P_FILE_ACCESS");
H5P.set_relax_file_integrity_checks(fapl,"H5F_RFIC_UNUSUAL_NUM_UNUSED_NUMERIC_BITS")
fid = H5F.open("myFilename.h5","H5F_ACC_RDONLY",fapl);
dset_id = H5D.open(fid,"myDatasetName");
myData = H5D.read(dset_id);
H5D.close(dset_id)
H5F.close(fid)
H5P.close(fapl)
|
myAttrValue = h5readatt("myFilename.h5","myDatasetName","myAttrName");
|
fapl = H5P.create("H5P_FILE_ACCESS");
H5P.set_relax_file_integrity_checks(fapl,"H5F_RFIC_UNUSUAL_NUM_UNUSED_NUMERIC_BITS")
fid = H5F.open("myFilename.h5","H5F_ACC_RDONLY",fapl);
dset_id = H5D.open(fid,"myDatasetName");
attrID = H5A.open(dset_id,"myAttrName");
myAttrValue = H5A.read(attrID);
H5A.close(attrID)
H5D.close(dset_id)
H5F.close(fid)
H5P.close(fapl)
|
h5writeatt("myFilename.h5","myDatasetName","myAttrName",myAttrValue);
|
fapl = H5P.create("H5P_FILE_ACCESS");
H5P.set_relax_file_integrity_checks(fapl,"H5F_RFIC_UNUSUAL_NUM_UNUSED_NUMERIC_BITS")
fid = H5F.open("myFilename.h5","H5F_ACC_RDWR",fapl);
dset_id = H5D.open(fid,"myDatasetName");

% Assumes myAttrName is an existing attribute.
% If it does not already exist, use H5A.create.
attrID = H5A.open(dset_id,"myAttrName");

H5A.write(attrID,"H5ML_DEFAULT",myAttrValue)
H5A.close(attrID)
H5D.close(dset_id)
H5F.close(fid)
H5P.close(fapl)
|
Mathematics
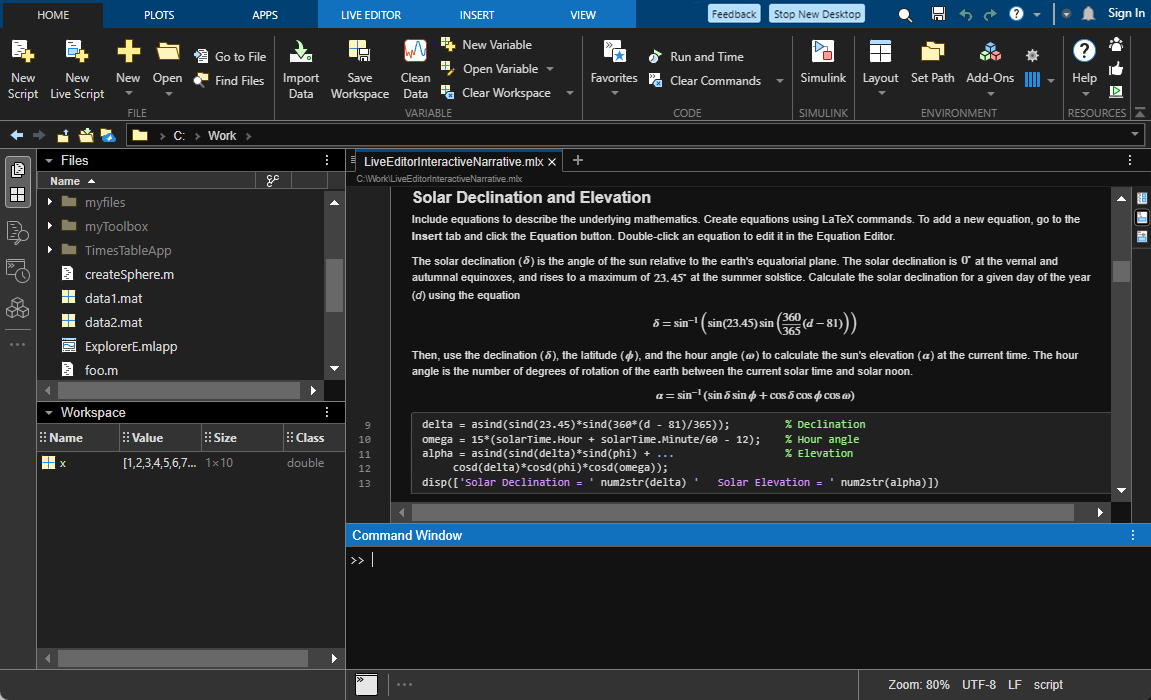
Solve ODE Live Editor Task: Interactively solve systems of ordinary differential equations
Use the Solve ODE (R2024b) task in the Live Editor to interactively solve a system of ordinary differential equations. You can specify the ODE structure and advanced problem details, select the solver, and visualize the solution in a plot. To add the task to a live script in the Live Editor, click Task on the Live Editor tab and select Solve ODE.
ode Object: Specify ODE as implicit
You can now specify the Solver property for ode (R2024b) objects as
"ode15i" for implicit ODEs. Alternatively, you can specify whether
your ODE is implicit by setting the new EquationType property for
ode objects to "standard" (default) or
"fullyimplicit". If you specify the Jacobian when the equation type
is "fullyimplicit", the Jacobian must be a function handle or cell
array.
For example, F =
ode(ODEFcn=@myFcn,EquationType="fullyimplicit",Jacobian=@Fjac) specifies an
implicit ODE.
ode Object: Detect stiffness to change solver after creating
ode object
You can change the solver after creating an ode (R2024b) object by
using the selectSolver method. Use the
DetectStiffness name-value argument to incorporate a stiffness
detection heuristic when selecting a solver.
For example, d.Solver = selectSolver(d,DetectStiffness="on") changes
the solver for ode object d by using a stiffness
detection heuristic.
ode Options: Set minimum step size for several ODE solvers
You can set a lower bound on the size of any step taken by MATLAB ODE solvers by
specifying the MinStep (R2024b)
name-value argument of the odeset function.
See the SolverOptions (R2024b) property of the ode (R2024b) object for
a list of the solvers that support setting a minimum step size.
lsqminnorm Function: Apply Tikhonov regularization to
least-squares solution
You can apply Tikhonov regularization to the least-squares solution of the lsqminnorm (R2024b)
function by specifying the RegularizationFactor name-value argument as
a real number. Specify the regularization factor lambda to return a
solution X that minimizes norm(A*X-B)^2 +
lambda^2*norm(X)^2 for each column of X.
For example, X = lsqminnorm(A,B,RegularizationFactor=1e-6) specifies
a Tikhonov regularization factor of 1e-6.
isapprox Function: Determine approximate equality of elements in
two arrays
Determine approximate equality of elements in two arrays and return a logical array
using the isapprox (R2024b)
function. You can define the maximum difference between approximately equal elements by
specifying a tolerance level or the relative and absolute tolerances.
layoutcoords Function: Calculate node and edge coordinates for the
layout of a graph or digraph
Use the layoutcoords (R2024b)
function to calculate the node and edge coordinates used when plotting a
graph or digraph object. While the
layout function changes the layout of an existing
GraphPlot object, layoutcoords enables you to
obtain the coordinates that would be used by a layout method without plotting the
network.
polyshape Object: Control whether subtract and
xor methods simplify output
You can control whether the subtract (R2024b) and
xor (R2024b) methods
of polyshape simplify their output by specifying the
Simplify name-value argument, which can be either
true (default) or false. By default, the methods
return a well-defined polygon by resolving boundary intersections and improper nesting and
by removing duplicate points and degeneracies. However, you can specify
Simplify=false to gain performance when performing a series of
subtractions or exclusive-or operations. In this case, you can simplify the output once at
the end either by specifying Simplify=true in the final method call or
by using the simplify method on the final output polygon.
MATLAB Support Package for Quantum Computing: Solve QUBO problems using QAOA (November 2024, Version 24.2.2)
You can solve a Quadratic Unconstrained
Binary Optimization (QUBO) problem using the quantum approximate optimization algorithm
(QAOA). Specify the algorithm for the solve function as a qaoa (R2024b) object. The resulting solution is a quboResult object
that contains a qaoaResult (R2024b) object.
You can also solve a max-cut problem using the solve function.
Convert the max-cut graph to an equivalent QUBO formulation by using the maxcut2qubo (R2024b) function, which returns a qubo object. For more
information, see Solve Max-Cut Problem Using QAOA (R2024b).
MATLAB Support Package for Quantum Computing: Calculate expected value and convert QUBO to Ising (February 2025, Version 24.2.4)
You can calculate the expected value of a quantum circuit or state using the observe (R2024b) function. Specify the basis to calculate the expected value in by
using an observable (R2024b) object or Hermitian matrix.
You can also convert a QUBO problem to an equivalent Ising observable using the
qubo2ising (R2024b) function, which returns an observable
object.
Functionality being removed or changed
ind2sub function no longer supports scalar input for array
size
Errors
When you use the ind2sub (R2024b) function, the input argument
for the size of the array must be a vector of positive integers with two or more
elements. In previous releases, ind2sub(sz,ind) treated a scalar
input size sz as the number of rows in the array and assumed the size
of the other dimensions to be 1. For
example:
[row,col] = ind2sub(6,[2 3 4])
row =

     2     3     4


col =

1 1 1sz results in an error. Instead, you must specify
sz as a vector of positive integers with two or more elements. For
example:[row,col] = ind2sub([6 1],[2 3 4])
MATLAB Support Package for Quantum Computing: run function no longer supports
OptimizationLevel argument (January 2025, Version
24.2.3)
Errors
The run (R2024b) function no longer supports the
OptimizationLevel name-value argument. Code that uses this
argument generates an error. This change affects all versions of MATLAB Support Package for Quantum Computing.
Graphics
violinplot Function: Visualize grouped numeric data by using violin
plots
To create violin plots for grouped numeric data, use the violinplot (R2024b)
function. Each violin plot displays the kernel density estimate for a group in the input
data. If you specify a matrix of input data, violinplot creates a
separate violin plot for each column in the matrix. You can also specify a positional
grouping variable to split your data into groups.

violinplot Function: Visualize grouped numeric data by using violin plots
compassplot Function: Create one or more compass plots in polar
axes
Use the compassplot (R2024b)
function to plot one or more sets of arrows originating from the origin in polar
coordinates. This function is recommended over the compass (R2024b) function because this function uses a PolarAxes
object, which provides more options for customization. For example, you can set
PolarAxes properties to display either degree or radian
theta units, adjust theta- and
r-axis limits, or adjust aspects of the tick labels.
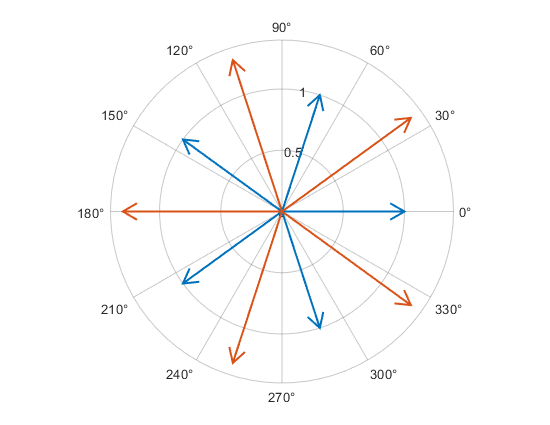
compassplot Function: Create one or more compass plots in polar axes
constantplane Function: Create infinite planes
Use the constantplane (R2024b)
function to create infinite planes for highlighting regions of interest in 3-D plots. This
function creates semitransparent gray planes by default, but you can change the color and
transparency by setting properties.
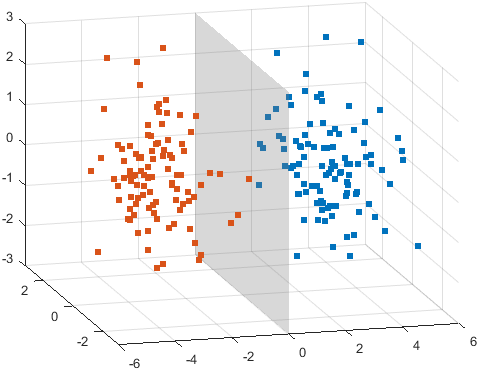
constantplane Function: Create infinite planes
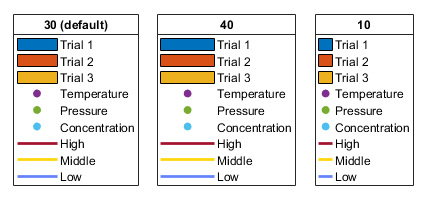
Legends: Control width of icons
Control the width of the legend icons and the width of the legend box by setting the
IconColumnWidth (R2024b) property of a Legend object.
If the legend contains only marker icons, MATLAB automatically minimizes the white space around the icons. Previously, legends included extra white space around the marker icons.
For example, these three legends are the same except for their
IconColumnWidth values (30,
40, and 10, respectively).
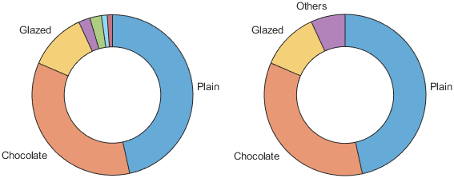
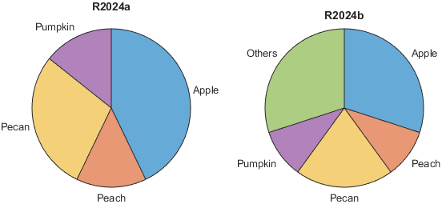
Pie Charts and Donut Charts: Control slice order and number of slices
Simplify pie charts and donut charts with large numbers of slices by setting properties
that control the order and number of slices. Use the DisplayOrder (R2024b)
property to arrange slices by size, and use the NumDisplayWedges (R2024b) property to specify the number of slices to display
separately (the remaining slice data is grouped together as a slice labeled
"Others").
Other useful properties include:
ShowOthers(R2024b) — Show or hide a slice labeled"Others"to represent values not shown as individual slices. For example,<undefined>categorical values are represented in the"Others"slice.WedgeDisplayNames(R2024b) — Return the labels of the slices shown in the chart.WedgeDisplayData(R2024b) — Return the data values of the slices shown in the chart.
For example, these two donut charts represent the same data, but the chart on the right
has a NumDisplayWedges property value of 3 and a
ShowOthers property value of "on".
Bar Charts: Add labels to ends of bars
Add labels to the ends of bars and position them using the Labels (R2024b) and
LabelLocation (R2024b)
properties of a Bar object. You can also adjust aspects of the font by
setting the LabelColor (R2024b),
FontName (R2024b), FontSize (R2024b),
FontWeight (R2024b), and FontAngle (R2024b) properties. To
create the labels with LaTeX markup, set the Interpreter (R2024b)
property.
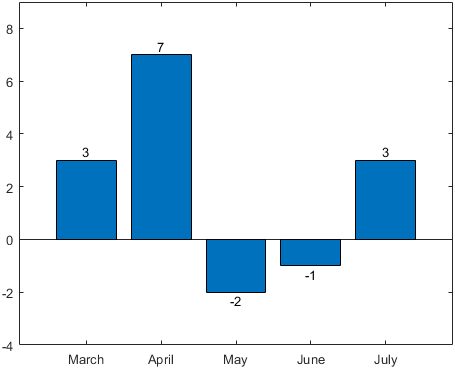
Bar Charts: Add labels to ends of bars
ConstantLine Object: Control text label color
Use the LabelColor (R2024b)
property to control the color of the text label of a ConstantLine object
created with the xline (R2024b) or yline (R2024b)
function.
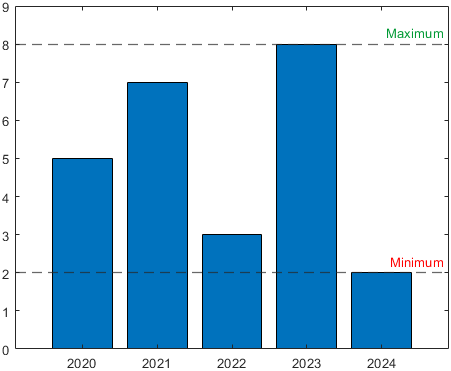
ConstantLine Object: Control text label color
tiledlayout Function: Create layouts without specifying dimensions
or tile arrangement
Call the tiledlayout (R2024b)
function without specifying the dimensions (m and n)
or the tile arrangement argument. When you omit these arguments,
tiledlayout creates a layout in the "flow"
configuration, which can accommodate any number of tiles.
savefig Function: Specify MAT file version
Specify the MAT file version as "-v7.3", "-v7", or
"-v6" when you create FIG files using the savefig (R2024b) function.
The "-v7.3" option supports FIG-files that are larger than 2 GB, and
the "-v7" option supports up to 2 GB files. The "-v6"
option stores the file using the MATLAB Version 5 format.
Name-Value Arguments: Set properties when you call pcolor,
sphere, cylinder, and other plotting
functions
Specify name-value arguments to set properties when you call pcolor (R2024b), sphere (R2024b), cylinder (R2024b), streamline (R2024b), waterfall (R2024b), ellipsoid (R2024b), feather (R2024b), surfl (R2024b), or ribbon (R2024b). Previously, these functions did not support name-value
arguments.
For example, specify the FaceColor and
EdgeColor name-value arguments when you call
pcolor.
pcolor(peaks,FaceColor="interp",EdgeColor="none")
Graphics in MATLAB Online: Copy images to clipboard
Now you can use the copygraphics (R2024b)
function to copy images to the clipboard in MATLAB
Online. Previously, you could use the copygraphics function
only in an installed version of MATLAB.
Functionality being removed or changed
piechart and donutchart show undefined
categorical values by default
Behavior change
The piechart (R2024b)
and donutchart (R2024b)
functions now include undefined categorical values and show them in a slice labeled
"Others" by default. Previously, the functions excluded undefined
values from the calculation of the Proportions property, and the
resulting chart did not include undefined values. This change makes it easier to
understand the nature of categorical data in the chart.
For example, create a pie chart using a categorical array containing three undefined
values (""). In R2024a, the chart excludes the undefined values. In
R2024b, the chart contains a slice labeled "Others" to represent the
undefined values.
cats = categorical(["Peach" "Apple" "Apple" "Apple" ...
                    "Pecan" "Pecan" "Pumpkin" "" "" ""]);
piechart(cats,LabelStyle="name")
To exclude the "Others" slice from the chart and exclude the
undefined values from the Proportions calculation, set the
ShowOthers (R2024b) property to "off".
piechart(cats,LabelStyle="name",ShowOthers="off")
savefig function saves FIG files that are no longer compatible
with R2014a and earlier releases
Behavior change
The savefig (R2024b) function now saves FIG files
using the compact format by default. As a result, if you save FIG files in R2024b, you
can open them only in R2014b and later releases. Previously,
savefig stored an extra copy of the figure that you could open
in R2014a and earlier releases. This change reduces the file size by approximately
50%.
If you specify the "compact" option when you call
savefig, MATLAB stores the same compact version of the FIG file that it saves by default.
Thus, the "compact" option is unnecessary, but it still runs in
R2024b without error. In a future release, the "compact" option will
be removed.
x-axis limits of stem plots are padded by default
Behavior change
Plots created with the stem (R2024b) function now have padding on the
right and left sides of the x-axis to prevent overlap with the edges
of the plot box.
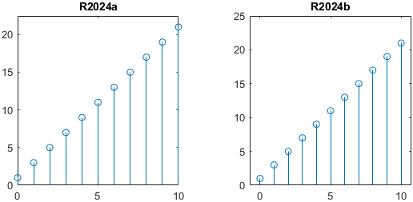
To preserve the appearance from previous releases, use the xlim (R2024b) function to adjust the limits of the x-axis. For
example, if the range of the x-coordinates is
[0,10], set the x-axis limits to
[0,10].
x = 0:10;
y = (2*x) + 1;
stem(x,y)
xlim(gca,[0 10])
Passing multidimensional arrays to isgraphics and
ishghandle returns output of same size
Behavior change
Passing arrays that have three or more dimensions to the isgraphics (R2024b) and ishghandle (R2024b) functions returns arrays of the
same size as the input. Previously, isgraphics and
ishghandle returned 2-D arrays when the input had three or more
dimensions. The higher dimensions were collapsed into the second dimension. For example,
if the input was a 2-by-4-by-5 array, the output was a 2-by-20 array.
If you pass a scalar, 1-D, or 2-D array to either function, the output is the same size as in previous releases.
If you use nested calls to the all (R2024b) or any (R2024b) function, update your code to use
the "all" argument instead of the nested function calls to preserve
the shape of the output.
For example, this code returns a scalar logical value in R2024a. In R2024b, it returns a 1-by-1-by-4 array of logical values.
h = gobjects(2,3,4);
all(all(isgraphics(h)))
To preserve the scalar output, call the all function once with
the "all" argument. The result is a scalar logical value.
h = gobjects(2,3,4);
all(isgraphics(h),"all")
hgsave and support for saving legacy FIG files will be
removed
Still runs
The hgsave (R2024b) function will be removed in a
future release. Use savefig (R2024b) to save FIG files instead. The
savefig function supports the same arguments and syntaxes that
the hgsave function supports, and it saves FIG files that are
compatible with R2014b and later releases.
When hgsave is removed, you will no longer be able to save
FIG-files compatible with R2014a and earlier releases.
hold all is not recommended
Still runs
The "all" option of the hold (R2024b) function is not recommended. Specify the "on"
option instead, which has the same effect. However, there are no plans to remove the
"all" option.
| Not Recommended | Recommended |
|---|---|
|
|
|
|
|
|
compass is not recommended
Still runs
The compass (R2024b) function is not recommended.
Use the compassplot (R2024b) function instead. The compassplot
function uses a PolarAxes object, which provides more options for
customization. For example, you can set PolarAxes properties to
display either degree or radian theta units, adjust
theta- and r-axis limits, or adjust aspects of
the tick labels. However, there are no plans to remove the compass
function.
Like other polar plotting functions, compassplot accepts polar
coordinates instead of Cartesian coordinates. Use the cart2pol (R2024b) function to convert your data. This table shows some typical
usages and how to update your code to use compassplot.
| Scenario | Not Recommended | Recommended |
|---|---|---|
Plot vectors of coordinates —
Convert the Cartesian values of |
compass(u,v) |
[theta,rho] = cart2pol(u,v); compassplot(theta,rho) |
Plot matrices of coordinates —
The |
compass(u,v) |
[theta,rho] = cart2pol(u,v); compassplot(theta,rho,SeriesIndex=1) |
Plot complex values |
compass(Z) |
compassplot(Z) |
Specify line style and color |
compass(u,v,"--r") |
[theta,rho] = cart2pol(u,v); compassplot(theta,rho,LineStyle="--",Color="r") |
Calling legend with multiple outputs will not be
supported
Warns
Calling the legend (R2024b) function with multiple output
arguments returns a warning that the syntax will be removed in a future release.
[lgd,icons,plots,txt] = legend(...)
This syntax creates a legend that does not support some functionality. For example, you cannot add a title to the legend or specify the number of legend columns. Also, the legend does not automatically update when you add or remove data series from the axes.
Instead, return the Legend object and set its properties. For a
complete list, see Legend Properties (R2024b).
lgd = legend(...)
opengl function will be removed
Warns
The opengl (R2024b) function returns a warning that
it will be removed in a future release. This function enables you to query or change the
renderer that MATLAB uses.
To query the renderer, use the
rendererinfo(R2024b) function instead of theopenglfunction.Changing the renderer will no longer be necessary when the function is removed.
axis function no longer returns limit selection mode, visibility,
and y-axis direction
Errors
Calling this three-output syntax of the axis (R2024b) function is no longer supported.
[m,v,d] = axis('state')You can get the same information by querying these Axes properties:
App Building
uibutton and uitogglebutton Functions:
Specify HTML markup and display equations in button text
Enable text markup for buttons created using the uibutton (R2024b) and uitogglebutton (R2024b) functions by setting the
Interpreter property. Specify the interpreter as
"html", "latex", "tex", or
"none".
For more information, see Button (R2024b), StateButton (R2024b), or ToggleButton (R2024b).
App Designer: Add UI components that span multiple grid cells more easily
In Design View, you can interactively add UI components that span multiple cells in a grid layout manager by dragging the component over multiple cells before dropping it on the canvas.
For more information, see Use Grid Layout Managers in App Designer (R2024b).
App Designer: Add UI components that span multiple grid cells more easily
App Designer: View errors directly in Code View when debugging an app
When you debug an app in App Designer with the Pause on Errors option selected, Code View displays any error that occurs next to the line of code that caused it. Previously, the error was displayed only in the MATLAB Command Window.
App Designer: Convert between text edit fields and numeric edit fields
To convert one type of edit field to another, right-click the edit field on the canvas and select Replace With. Then, select the edit field type to convert to. Replacing one edit field with another preserves relevant property values, such as font properties and callbacks that exist for both components.
App Testing Framework: Programmatically interact with alert and confirmation dialog boxes
You can programmatically interact with a modal dialog box in front of a figure window by using two new methods in the app testing framework:
To select an option in a confirmation dialog box, use the
chooseDialog(R2024b) method.To dismiss an alert or confirmation dialog box, use the
dismissDialog(R2024b) method.
App Testing Framework: Specify location of gesture on figures that use nonpixel units
You can specify the location of a gesture on a UI figure that uses any unit of
measurement. In previous releases, the press (R2024b), drag (R2024b), hover (R2024b), and
chooseContextMenu (R2024b) methods let you specify coordinates only for figures whose
Units property is set to "pixels".
For example, create a figure with its Units property set to
"normalized". Then, programmatically press a point near the
lower-left corner of the figure.
fig = uifigure(Units="normalized");

testCase = matlab.uitest.TestCase.forInteractiveUse;
testCase.press(fig,[0.1 0.1])
Functionality being removed or changed
dismissAlertDialog method is not recommended
Still runs
The dismissAlertDialog (R2024b) method is not recommended. Use dismissDialog (R2024b) instead. There are no plans to remove
dismissAlertDialog. However, the dismissDialog
method provides more functionality and is not limited to alert dialog boxes. For
example, you can use the dismissDialog method to close an alert dialog
box or a confirmation dialog box.
This table shows how to update your code to use dismissDialog
instead.
| Not Recommended | Recommended |
|---|---|
fig = uifigure; uialert(fig,"File not found","Invalid File") testCase = matlab.uitest.TestCase.forInteractiveUse; testCase.dismissAlertDialog(fig) |
fig = uifigure; uialert(fig,"File not found","Invalid File") testCase = matlab.uitest.TestCase.forInteractiveUse; testCase.dismissDialog("uialert",fig) |
Specifying location of gesture on axes or UI axes with active right y-axis is no longer supported
Errors
Using the press (R2024b),
drag (R2024b),
hover (R2024b), or
chooseContextMenu (R2024b) method to specify the location of a gesture on axes or UI
axes with an active right y-axis is no longer supported. In previous
releases, when you specify the location on axes or UI axes with an active right side,
the app testing framework interprets that location with respect to the left
y-axis, which can cause the gesture to occur at an unexpected
location or fail.
If your chart has two y-axes, activate the left side before performing a gesture at a specified location on the axes or UI axes. This table shows an example of how you can update your code.
| Before | After |
|---|---|
fig = uifigure; ax = axes(fig); yyaxis(ax,"left") plot(ax,1:10) yyaxis(ax,"right") plot(ax,10:-1:1) testCase = matlab.uitest.TestCase.forInteractiveUse; testCase.press(ax,[5 5]) |
fig = uifigure; ax = axes(fig); yyaxis(ax,"left") plot(ax,1:10) yyaxis(ax,"right") plot(ax,10:-1:1) testCase = matlab.uitest.TestCase.forInteractiveUse; yyaxis(ax,"left") testCase.press(ax,[5 5]) |
Performance
datetime Format Parsing: Improved performance when parsing common
formats that include localized names or time zone offsets
datetime (R2024b) format parsing performance is
significantly faster when parsing common formats that include localized names or time zone
offsets. This list shows a few examples of such formats, which are part of ongoing efforts
to improve datetime format parsing performance:
dd-MMM-uuuu HH:mm:ssMMMM/dd/uuuuQQQ-uuuuuuuu-MM-dd HH:mm:ss Zuuuu-MM-dd HH:mm:ss.SSS xxx
For example, this code creates a string array of dates that use a localized abbreviation
for the month of April. The dates in the string array use the dd-MMM-uuuu
HH:mm:ss format, where the MMM specifier represents the
abbreviated month name. Then the code uses the datetime function to
parse and convert the string array. The code is about 17x faster than in the previous
release.
function timingTest
s = "23-Apr-2024 11:30:" + randi([10,59],10000,1);
for i = 1:100
    d = datetime(s, ...
        InputFormat="dd-MMM-uuuu HH:mm:ss", ...
        Locale="en_US");
end
end
The approximate execution times are:
R2024a: 4.75 s
R2024b: 0.27 s
Similarly, this code creates a string array of dates that have a time zone offset of
-0400. The dates in the string array use the uuuu-MM-dd
HH:mm:ss.SSS Z format, where the Z specifier represents the
time zone offset. Then the code uses the datetime function to parse
and convert the string array. The code is about 5.8x faster than in the previous
release.
function timingTest
s = "2024-04-23 11:32:48." + randi(999,10000,1) + " -0400";
for i = 1:100
    d = datetime(s, ...
        InputFormat="uuuu-MM-dd HH:mm:ss.SSS Z", ...
        TimeZone="local");
end
end
The approximate execution times are:
R2024a: 6.35 s
R2024b: 1.10 s
In both cases, the code was timed on a Windows® 11, AMD EPYC™ 74F3 24-Core Processor @ 3.19 GHz test system using the
timeit function.
timeit(@timingTest)
median Function: Improved performance when computing weighted
median
The median (R2024b) function shows improved performance
when you specify a weighting scheme. For example, this code computes the weighted median of
a 600-by-10 matrix. The code is about 1.8x faster than in the previous release.
function timingTest
A = rand(600,10);
W = rand(600,1);

for i = 1:3e3
   median(A,Weights=W);
end
end
The approximate execution times are:
R2024a: 1.00 s
R2024b: 0.55 s
The code was timed on a Windows 11, AMD EPYC 74F3 24-Core Processor @ 3.19 GHz test system using the
timeit
function.
timeit(@timingTest)
fillmissing Function: Improved performance when filling numeric
entries using nearest neighbor rows
The fillmissing (R2024b) function shows improved
performance when you specify the fill method as "knn" for numeric data
and use the Euclidean or scaled Euclidean distance function to find the nearest neighbor
rows. The improvement is most significant when the length of the input data along the
operating dimension is small.
For example, this code fills the NaN values in an 800-by-10 matrix
using the nearest neighbor rows. The code is about 2.8x faster than in the previous
release.
function timingTest
A = rand(800,10);
A(A>0.95) = NaN;

for i = 1:2e2
   F = fillmissing(A,"knn");
end
end
The approximate execution times are:
R2024a: 1.00 s
R2024b: 0.36 s
The code was timed on a Windows 11, AMD EPYC 74F3 24-Core Processor @ 3.19 GHz test system using the
timeit
function.
timeit(@timingTest)
isprime Function: Improved performance when determining which
array elements are prime
The isprime (R2024b) function shows improved performance
when determining whether the integer elements of an array are prime. For example, this code
checks if the elements of a 1-by-1,000,000 vector of integers are prime. The code is about
20x faster than in the previous release.
function timingTest
x = 1:1e6;
tf = isprime(x);
end
The approximate execution times are:
R2024a: 2.81 s
R2024b: 0.14 s
The code was timed on a Windows 11, AMD EPYC 74F3 24-Core Processor @ 3.19 GHz test system using the
timeit
function.
timeit(@timingTest)
simplify Function: Improved performance when simplifying
polyshape objects with many boundaries
The simplify (R2024b)
function shows improved performance when operating on polyshape (R2024b)
objects with many boundaries. For example, this code simplifies a
polyshape object with 11,100 vertices. The code is about 23x faster
than in the previous release.
function t = timingTest
n = 300;
x = (1:n)'*[sind(0:10:360),NaN];
y = (1:n)'*[cosd(0:10:360),NaN];
p = polyshape(x(:),y(:),Simplify=false);

f = @() simplify(p);

t = timeit(f);
end
The approximate execution times are:
R2024a: 0.28 s
R2024b: 0.012 s
The code was timed on a Windows 11, AMD EPYC 74F3 24-Core Processor @ 3.19 GHz test system by calling the
timingTest function.
waitbar Function: Improved performance when updating wait bar
dialog box in loop
Updating a wait bar dialog box created using the waitbar (R2024b) function shows improved performance when the updates happen many
times in a loop. For example, this code updates a wait bar dialog box progress bar and
message while approximating the value of π. The code is about 3.9x faster than in the
previous release.
function timingTest
f = waitbar(0,"1",Name="Approximating pi...");
pisqover8 = 1;
denom = 3;
valueofpi = sqrt(8*pisqover8);
steps = 20000;

tic
for step = 1:steps
    waitbar(step/steps,f,sprintf('%12.9f',valueofpi))
    pisqover8 = pisqover8 + 1/(denom*denom);
    denom = denom + 2;
    valueofpi = sqrt(8*pisqover8);
end
toc

delete(f)
end
The approximate execution times are:
R2024a: 58.7 s
R2024b: 14.9 s
The code was timed on a Windows 11, AMD EPYC 74F3 24-Core Processor @ 3.19 GHz test system by calling the
timingTest function.
Plot Animations: Improved performance when updating charts that have legends in loop
Updating graphics properties in a loop shows improved performance when the axes object contains multiple graphics objects and a legend. The improvement increases with the number of graphics objects in the axes.
For example, plot 10 lines and add a legend.
axes
hold on
numLines = 10;
for i = 1:numLines
    plot(i:i+10);
end
legend(Location="eastoutside")
Calculate values of a sine wave and store them as y. Create another
line, p1, with NaN coordinate values. Animate the
line in a loop by appending y(i) to the YData
property of p1 at each iteration. This code is about 5x faster than in
the previous release.
% Calculate sine values and create p1
x = 1:0.05:11;
y = sin(x)*10+10;
p1 = plot(x,nan(1,numel(x)));

% Animate p1
tic
for i = 1:numel(x)
    p1.YData(i) = y(i);
    drawnow
end
toc
The approximate execution times are:
R2024a: 14.14 s
R2024b: 2.89 s
The code was timed on a Windows 11, Intel® Xeon® CPU W-2133 @ 3.60 GHz test system.
Plots in Apps: Improved performance when creating surface plots of large data sets
In apps, creating surface plots of large data sets shows improved performance. For
example, create an app window using the uifigure function, and create
an axes object using the axes function. Call the
drawnow function to complete the figure and axes setup. Then plot a
1000-by-1000 sampling of the peaks data set using the surf (R2024b) function. The code is about 1.3x faster than in the previous
release.
% Create app window and axes
f = uifigure;
a = axes(f);
drawnow

% Plot surface
tic
surf(a,peaks(1000), ...
    FaceColor="interp",EdgeColor="none")
drawnow
toc
The approximate execution times are:
R2024a: 0.478 s
R2024b: 0.356 s
The code was timed on a Windows 11, AMD EPYC 74F3 24-Core Processor @ 3.19 GHz test system that has an NVIDIA® A16-2Q GPU with 2 GB RAM.
Create Plot Live Editor Task: Improved loading performance
Loading the Create Plot (R2024b) task in the Live Editor is faster in R2024b than in R2024a. When you add the task to a live script, it takes less time for the task to appear in the Live Editor.
For example, if you add the Create Plot task to a new script in the Live Editor, the task appears about 1.2x faster than in the previous release.
The approximate load times are:
R2024a: 19.9 s
R2024b: 16.4 s
If you add another Create Plot task to the same live script, the additional task appears about 1.4x faster than in the previous release.
The approximate load times are:
R2024a: 5.7 s
R2024b: 4.0 s
The actions were timed on a Windows 11, Intel Xeon Gold 6246R CPU @ 3.40 GHz test system.
Software Development Tools
Project API: Specify dependency analysis scope
When you analyze a project using the updateDependencies (R2024b) function, you can specify the dependency analysis scope.
For example, to analyze dependencies inside add-ons, use
updateDependencies(currentProject,AnalyzeAddOns=true).
Project API: Label multiple project files at once
You can programmatically attach a label to multiple project files at once using
addLabel (R2024b). You
can also detach a label from multiple files using removeLabel (R2024b).
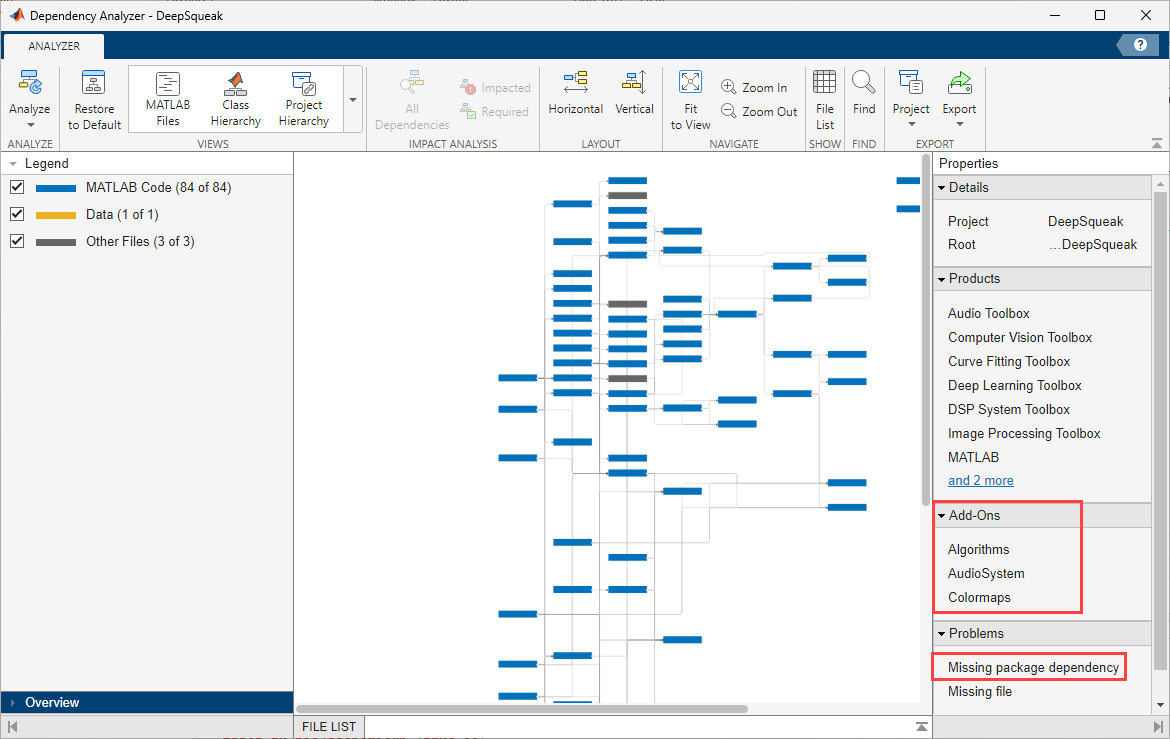
Dependency Analyzer: Find required packages and missing package dependencies
When you run a dependency analysis on your code, the Dependency Analyzer lists the required packages in the Add-Ons section of the Properties pane. For more information, see Find Required Products and Add-Ons (R2024b).
The Dependency Analyzer also flags any missing package dependencies in the Problems section. For more information, see Investigate and Resolve Problems (R2024b).
Source Control in MATLAB Online: Expanded support for Git workflows
MATLAB Online now provides expanded support for Git™ workflows.
Annotate lines in the MATLAB Editor using Git history.
Check out a Git branch to a different folder using Git work trees.
Project Issues in MATLAB Online: View and fix project startup and shutdown issues
In MATLAB Online, you can view all issues that occur during project startup and shutdown using the Project Issues panel. When possible, this panel provides automatic fixes or suggests next steps.
Code Analyzer: Check code for specified variable names
Configure the Code Analyzer to display a custom check when specific variable names are
used. To create a new check, you must assign a check ID that is a valid MATLAB identifier.
For example, you can define "MyVariableCheck" to check for variables
with the names size, error, or
length.
For more information, see Add Custom Checks for Specified Variable Names (R2024b).
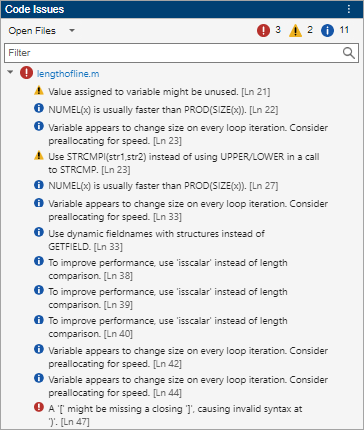
Code Analyzer in MATLAB Online: Check code for info messages
In MATLAB Online, you can view info messages about your code in the Code Issues panel, as well as in the Editor and Live Editor. Info messages are suggestions for how to improve your code, and they can be related to code readability, outdated functionality, and formatting improvements.
To open the Code Issues panel, go to the Editor or Live
Editor tab, and in the Analyze section, click
Code Issues. To change which types of messages are underlined in the
Editor and Live Editor, go to the Home tab, and in the
Environment section, click ![]() Preferences. Select MATLAB > Code Analyzer, and then select an Underlining option.
Preferences. Select MATLAB > Code Analyzer, and then select an Underlining option.
For more information, see Check Code for Errors and Warnings Using the Code Analyzer (R2024b).
Build Automation: Create and run group of tasks
You can treat similar tasks as a single unit of work in the build tool. For instance, you can create a group of all the tasks in your project that build binary MEX files, and then list, plot, or run the grouped tasks. For an example of how to create and run a task group, see Build MEX Files Using Task Group (R2024b).
Build Automation: Specify task names more flexibly
You can specify the name of a matlab.buildtool.Task (R2024b) instance as a string scalar or character vector of any
length that contains alphanumerics (A–Z, a–z, 0–9), underscores, dashes, and periods. In
previous releases, the task name must be a valid MATLAB identifier.
Build Automation: Produce code coverage results using coverage formats
To produce customized code coverage results, you can pass a vector of code coverage
formats to the addCodeCoverage (R2024b)
method of the matlab.buildtool.tasks.TestTask class. For more information
and an example, see results (R2024b).
Build Automation: Specify build file and verbosity level
You can specify additional options when running a build with the buildtool (R2024b) command:
To run a build using a specified build file, use the
-buildFileoption.To control the amount of information displayed during a build run, use the
-verbosityoption.
For example, run the default tasks in a build file located in a subfolder of your current folder, and display build output at the maximum verbosity level.
buildtool -buildFile mySubfolder\buildfile.m -verbosity Verbose
Build Automation: Load plan from folder into workspace
You can load a plan from a folder that contains a build file into the MATLAB workspace by using the matlab.buildtool.Plan.load (R2024b) method. The build file must be named
buildfile.m and be located directly within the folder that you pass
to the method.
Build Automation: Delete additional task outputs
To delete outputs of a task, a matlab.buildtool.tasks.CleanTask (R2024b) instance searches through both the actual and
expected outputs:
Actual outputs — Outputs on disk that the task produced when it last ran successfully (stored in the task trace)
Expected outputs — Outputs that the task would produce if it ran at cleanup time (specified in the build plan)
For example, if you change the inputs or outputs of a task in the build file, a
CleanTask instance deletes the outputs on disk from the last task run
even if the build file no longer represents them. In previous releases, a
CleanTask instance misses such outputs because it searches only for
outputs that are expected to exist on disk when cleanup takes place.
Unit Testing Framework: Run function in environment provided by fixtures
You can use the applyAndRun (R2024b)
method of the matlab.unittest.fixtures.Fixture class to run a function in
the environment provided by one or more fixtures. The method sets up the fixtures before
running the function and tears them down after running the function.
Unit Testing Framework: Control test runner verbosity using
testrunner function
You can specify the display level of test output detail and verbosity level of logged
diagnostics when you create a test runner using the testrunner (R2024b)
function. For example, run the tests in a test class by using a test runner that displays
test output detail at the maximum verbosity
level.
suite = testsuite("MyTestClass");
runner = testrunner("textoutput",OutputDetail="verbose");
results = run(runner,suite);
Unit Testing Framework: Add tests from currently open test file or clear test results using Test Browser
You can use Test Browser (R2024b) menu options to:
Add the tests from the currently open test file to the test browser. Click the drop-down arrow () on the toolbar and then select Current File.
Clear the test results and return all the tests to a Not Run status . Click the three-dot button () on the toolbar and then select Clear test results.
Unit Testing Framework: Control whether to use Test Browser from toolstrip in MATLAB Online
In MATLAB Online, when you run a function-based or class-based test file using the Run Tests section on the toolstrip, you can control whether to run the tests and display results using the Test Browser (R2024b) app. To access this test option, with your test file open, on the Editor or Live Editor tab, select Run Tests > Customize Test Run, and then select or clear the Use Test Browser option.
If you choose not to use the test browser by clearing the Use Test Browser option, then your tests run in the Command Window instead. Your selection persists across MATLAB sessions.
App Testing Framework: Programmatically interact with alert and confirmation dialog boxes
You can programmatically interact with a modal dialog box in front of a figure window by using two new methods in the app testing framework:
To select an option in a confirmation dialog box, use the
chooseDialog(R2024b) method.To dismiss an alert or confirmation dialog box, use the
dismissDialog(R2024b) method.
App Testing Framework: Specify location of gesture on figures that use nonpixel units
You can specify the location of a gesture on a UI figure that uses any unit of
measurement. In previous releases, the press (R2024b), drag (R2024b), hover (R2024b), and
chooseContextMenu (R2024b) methods let you specify coordinates only for figures whose
Units property is set to "pixels".
For example, create a figure with its Units property set to
"normalized". Then, programmatically press a point near the
lower-left corner of the figure.
fig = uifigure(Units="normalized");

testCase = matlab.uitest.TestCase.forInteractiveUse;
testCase.press(fig,[0.1 0.1])
MATLAB Package Manager: Organize and distribute code using packages
Use the Package Management (R2024b) to create, find, install, and manage MATLAB packages. A package is a collection of MATLAB code, related files, and a package definition file that defines the package identity and dependencies. The purpose of a package is to compartmentalize code so that it can be shared while maintaining its intended functionality. When installing a package, the MATLAB Package Manager installs all of the code, supporting files, and any other packages that it depends on. For more information, see Organize and Distribute Code Using MATLAB Package Manager (R2024b).
MATLAB keeps a list of known repositories. A package repository is a designated location where packages are available for distribution. Authors can place packages in a package repository, and other users can then install those packages. You can manage the set of known package repositories directly within MATLAB. For more information, see Distribute Packages Using Folder-Based Repositories (R2024b).
Functionality being removed or changed
dismissAlertDialog method is not recommended
Still runs
The dismissAlertDialog (R2024b) method is not recommended. Use dismissDialog (R2024b) instead. There are no plans to remove
dismissAlertDialog. However, the dismissDialog
method provides more functionality and is not limited to alert dialog boxes. For
example, you can use the dismissDialog method to close an alert dialog
box or a confirmation dialog box.
This table shows how to update your code to use dismissDialog
instead.
| Not Recommended | Recommended |
|---|---|
fig = uifigure; uialert(fig,"File not found","Invalid File") testCase = matlab.uitest.TestCase.forInteractiveUse; testCase.dismissAlertDialog(fig) |
fig = uifigure; uialert(fig,"File not found","Invalid File") testCase = matlab.uitest.TestCase.forInteractiveUse; testCase.dismissDialog("uialert",fig) |
Specifying location of gesture on axes or UI axes with active right y-axis is no longer supported
Errors
Using the press (R2024b),
drag (R2024b),
hover (R2024b), or
chooseContextMenu (R2024b) method to specify the location of a gesture on axes or UI
axes with an active right y-axis is no longer supported. In previous
releases, when you specify the location on axes or UI axes with an active right side,
the app testing framework interprets that location with respect to the left
y-axis, which can cause the gesture to occur at an unexpected
location or fail.
If your chart has two y-axes, activate the left side before performing a gesture at a specified location on the axes or UI axes. This table shows an example of how you can update your code.
| Before | After |
|---|---|
fig = uifigure; ax = axes(fig); yyaxis(ax,"left") plot(ax,1:10) yyaxis(ax,"right") plot(ax,10:-1:1) testCase = matlab.uitest.TestCase.forInteractiveUse; testCase.press(ax,[5 5]) |
fig = uifigure; ax = axes(fig); yyaxis(ax,"left") plot(ax,1:10) yyaxis(ax,"right") plot(ax,10:-1:1) testCase = matlab.uitest.TestCase.forInteractiveUse; yyaxis(ax,"left") testCase.press(ax,[5 5]) |
Toolstrip in MATLAB Online no longer includes the Section section for test files
Behavior change
Because creating and running sections in function-based and class-based test files is not common, if you open a function-based or class-based test file in MATLAB Online, the Section section no longer appears on the Editor or Live Editor tab.
Legacy command-line SVN integration is no longer supported
Legacy command-line SVN integration had limited functionality and required installation of an additional command-line SVN client. Starting in R2024b, the command-line SVN integration is no longer supported. Use the built-in SVN integration instead.
This illustration shows the deprecated Command-line SVN integration (compatibility mode) option in the Manage Files Using Source Control dialog box. Use the SVN (1.9) option instead.
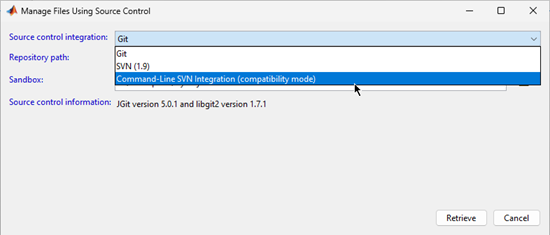
External Language Interfaces
REST Function Service: Automatic restart after MathWorks Service Host update
MATLAB REST function services rely on the MathWorks® Service Host (MSH) for communication with MATLAB from client applications. MSH regularly releases updates and restarts automatically after updates are installed. If services are running before the update, the REST function connector stops during the update and then automatically restarts, along with the running services, when the MSH is available.
Any computations or requests made by your program during the update cannot be recovered.
If you have long-running function calls, you can specify a preferred restart time to avoid
interruption of your workflow and possible loss of data. For more information, see the
PreferredRestartHour (R2024b)RESTFunctionConnector object.
Call C++ from MATLAB: Convert MATLAB structures to C++ struct arrays when passing data from
MATLAB
You can pass a MATLAB structure as a parameter to a C++ function. MATLAB converts the structure to a C++ struct argument. For more
information, see Pass struct Parameter (R2024b).
You can convert MATLAB structures to C++ struct arrays using the clibConvertArray (R2024b) function.
For information about publishing C++ functions with struct parameters
that accept MATLAB structures, see Supported struct Types (R2024b).
Call MATLAB from C++: Create MATLAB data arrays from user-managed buffers
You can create a MATLAB data array (MDA) using memory already allocated, without copying data or
allocating extra memory, using the MATLAB Data API for C++ function createArrayFromBuffer (R2024b). When you create an MDA from a buffer, you can specify
a custom deleter function to manage the buffer. For more information, see Create MATLAB Data Array and Manage Memory from User-Managed Buffer (R2024b).
Call MATLAB from C++: Create matlab::data::CharArray from UTF-8
input
Use the createCharArrayFromUTF8 (R2024b) function of the MATLAB Data API for C++ matlab::data::ArrayFactory class to create a
matlab::data::CharArray (R2024b) object from an
std::string of UTF-8 characters.
Java: Support for OpenJDK 21 Java
MATLAB now supports OpenJDK® 21 Java® from https://adoptium.net/. For
supported version information, see MATLAB Interfaces to Other Languages.
Python: Support for CPython version 3.12
MATLAB now supports CPython version 3.12, in addition to existing support for versions 3.9, 3.10, and 3.11. For supported version information, see Versions of Python Compatible with MATLAB Products by Release.
Call Python from MATLAB: Follow Python type hints when passing data from MATLAB
MATLAB can automatically convert a floating-point integer to a Python®
int when passing data to a Python function. This conversion occurs if a Python type hint specifies an integer data type. For more information, see Pass MATLAB Data to Python (R2024b).
Call MATLAB from Python: Convert between Python and MATLAB dictionaries
When passing data from Python to MATLAB, you can more easily convert Python dictionaries to MATLAB dictionaries. To convert a Python
dict to a MATLAB
dictionary, first convert the Python
dict to a matlab.dictionary object, and then pass the
matlab.dictionary object to MATLAB.
Additionally, MATLAB can now pass a MATLAB dictionary to Python as a matlab.dictionary object. A
matlab.dictionary object behaves like a Python
dict.
For more information, see Use MATLAB Dictionaries in Python (R2024b).
.NET: Cross-platform support for .NET 6 and higher
In addition to existing support on Microsoft® Windows platforms, MATLAB now supports .NET Runtime 6.0 and higher on macOS and Linux® platforms. For more information, see System Requirements for Using MATLAB Interface to .NET (R2024b).
.NET: Support for .NET 8
MATLAB now supports .NET 8, in addition to existing support for the Microsoft .NET Framework. For supported version information, see MATLAB Interfaces to Other Languages.
Compilers: Support for Intel C++ icx and Fortran ifx
MATLAB supports two additional compilers for building C and C++ interfaces, MEX files, and standalone MATLAB engine and MAT-file applications on Windows platforms.
| Support | Compiler | Platform |
|---|---|---|
Added | Intel oneAPI DPC++/C++ Compiler (icx) | Windows |
Added | Intel Fortran Compiler (ifx) | Windows |
For continued support for building your applications, consider upgrading to a supported compiler. For an up-to-date list of supported compilers, see Supported and Compatible Compilers.
Hardware Support
Arduino Hardware: Support for Arduino UNO R4 WiFi and Minima boards
You can now use the MATLAB Support Package for Arduino® Hardware to communicate with the Arduino UNO R4 WiFi board over USB and WiFi and the
Arduino UNO R4 Minima board over USB. Use the arduino (R2024b) object to connect to the two boards.
However, you cannot use the support package to interface the two boards with a servo motor, Adafruit Motor Shield V2, motor carrier, serial devices, or sensors. Also, this feature is available only when you use the MATLAB Support Package for Arduino Hardware in the installed version of MATLAB.
Arduino Hardware: Use MATLAB Support Package for Arduino Hardware in MATLAB Online through web browser
Starting in R2024b, you can use MATLAB Support Package for Arduino Hardware in MATLAB Online to communicate with Arduino hardware through your web browser. You must install the MATLAB Connector™ on your host computer to use the support package in MATLAB Online. For more information, see Get Started with MATLAB Online for Arduino.
Raspberry Pi Hardware: Support for Debian 12 Bookworm
You can now use the MATLAB Support Package for Raspberry Pi® Hardware with boards that have the Debian® 12 Bookworm Raspberry Pi operating system installed.
Raspberry Pi Hardware: libcamera support on camera boards with
Bullseye and Bookworm operating systems
The libcamera packages are now installed as part of the MATLAB Support Package for Raspberry Pi Hardware for the Bullseye and Bookworm operating systems. The
libcamera functionality is available when you enable the camera module peripheral in the Hardware Setup tool.
As part of the libcamera update, the cameraboard (R2024b) object no longer displays the ImageEffect and
VideoStabilization properties for the Bullseye and Bookworm operating
systems.
Raspberry Pi Hardware: Support for Raspberry Pi 5
You can now use the MATLAB Support Package for Raspberry Pi Hardware with the Raspberry Pi 5 board. This support is available in the installed version of MATLAB and MATLAB Online.
However, you cannot use the Raspberry Pi 5 board with a camera board, servo motor, or pulse width modulation (PWM) signals.
Raspberry Pi Hardware: Support for Camera with Raspberry Pi 5 (December 2024 Version 24.2.3)
Starting in version 24.2.3 of MATLAB Support Package for Raspberry Pi Hardware, you can interface a camera board and an ArduCam multi-camera adapter module with the Raspberry Pi 5 board. This support is available for both MATLAB Online and the desktop environment.
Functionality being removed or changed
enableI2C, disableI2C,
enableSPI and disableSPI functions have
been removed
Errors
These functions have been removed:
enableI2CdisableI2CenableSPIdisableSPI
Instead, in the Hardware Setup tool, use the Configure Peripheral Modules window to enable or disable I2C and SPI interfaces on Raspberry Pi.
