plotsomnd
Plot self-organizing map neighbor distances
Syntax
plotsomnd(net)
Description
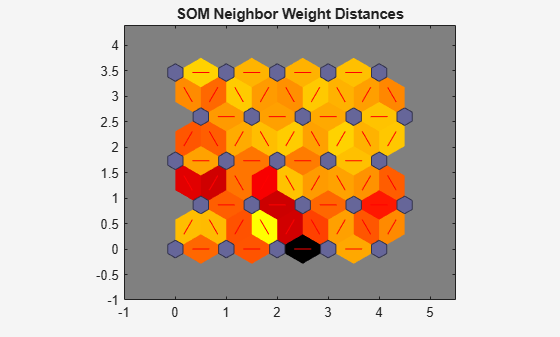
plotsomnd(net) plots a SOM layer showing neurons as
gray-blue patches and their direct neighbor relations with red lines. The neighbor patches are
colored from black to yellow to show how close each neuron’s weight vector is to its
neighbors.
This plot supports SOM networks with hextop and
gridtop topologies, but not tritop or
randtop.
Examples
Plot SOM Neighbor Distances
x = iris_dataset;
net = selforgmap([5 5]);
net = train(net,x);

plotsomnd(net)
Version History
Introduced in R2008a
See Also
You can also select a web site from the following list:
Americas
- América Latina (Español)
- Canada (English)
- United States (English)
Europe
- Belgium (English)
- Denmark (English)
- Deutschland (Deutsch)
- España (Español)
- Finland (English)
- France (Français)
- Ireland (English)
- Italia (Italiano)
- Luxembourg (English)
- Netherlands (English)
- Norway (English)
- Österreich (Deutsch)
- Portugal (English)
- Sweden (English)
- Switzerland
- United Kingdom (English)