extract
Extract time-domain, frequency-domain, or time-frequency-domain features
Since R2021b
Syntax
Description
[
returns a matrix features,info,framelimits] = extract(sFE,x)framelimits whose i-th row contains
the beginning and end limits of the i-th frame. This syntax is valid only
when you set the FeatureFormat property of the feature extractor object
to "matrix".
Examples
Extract Daily Peaks from Temperature Data
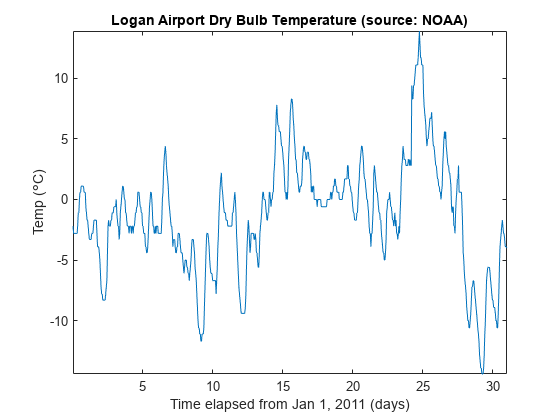
Load a set of temperature readings in Celsius taken every hour at Logan Airport in Boston for 31 days. Plot the data.
load bostemp
days = (1:31*24)/24;
plot(days, tempC)
axis tight
ylabel('Temp (\circC)')
xlabel('Time elapsed from Jan 1, 2011 (days)')
title('Logan Airport Dry Bulb Temperature (source: NOAA)')
Create a signalTimeFeatureExtractor object and enable the PeakValue feature. To obtain the maximum absolute temperature reading per day, set the frame size to 24 samples and the frame overlap to 0 samples.
sFE = signalTimeFeatureExtractor(FrameSize=24,FrameOverlapLength=0,PeakValue=true);
Call the extract function on the object to extract the daily absolute maximum temperatures in the data set.
peaktemps = extract(sFE,tempC)
peaktemps = 31×1

    2.8000
    6.1000
    8.3000
    3.3000
    2.8000
    4.4000
    4.4000
    6.1000
   10.6000
   11.7000
      ⋮
Confirm the extracted peak values. Divide the signal into 24-sample segments representing temperature readings per day and compute the maximum absolute value of each segment. Compare the resulting vector to peaktemps.
y = buffer(tempC,24);
[mx,idx] = max(abs(y));

tf = isequal(peaktemps,mx')
tf = logical
   1
Extract Mean Values from Timetable Data
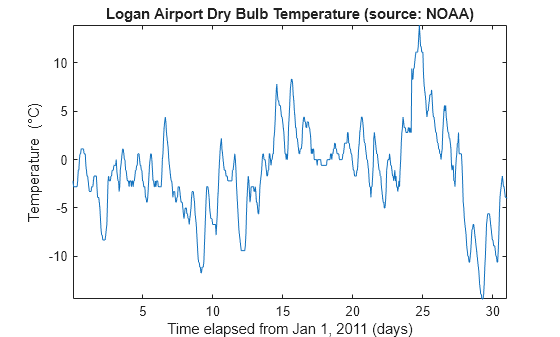
Load a set of temperature readings in Celsius taken every hour at Logan Airport in Boston for 31 days. Plot the data.
load bostemp
days = (1:31*24)/24;
plot(days,tempC)
axis tight
ylabel("Temp (\circC)")
xlabel("Time elapsed from Jan 1, 2011 (days)")
title("Logan Airport Dry Bulb Temperature (source: NOAA)")
Convert the array of temperature readings to a timetable. The first temperature reading was taken on January 1, 2011.
tt = array2timetable(tempC,TimeStep=hours(1),StartTime=datetime(2011,01,01));
Create a signalTimeFeatureExtractor object and enable the Mean feature to obtain the weekly average temperatures. Specify the sample rate and frame size (1 week = 168 hours) of the extractor. Set the output format of the extracted values to a table.
fs = 1/3600;
sFE = signalTimeFeatureExtractor(SampleRate=fs,FrameSize=168,Mean=true,FeatureFormat="table");
Call the extract function to extract the weekly average temperatures from the data set. The function does not include the readings taken in the last three days (72 hours) since they do not span a full week.
meantemps = extract(sFE,tt)
meantemps=4×3 table
    FrameStartTime    FrameEndTime     Mean
    ______________    ____________    _______

           1              168         -1.8357
         169              336         -4.3095
         337              504          1.7976
         505              672          2.0911
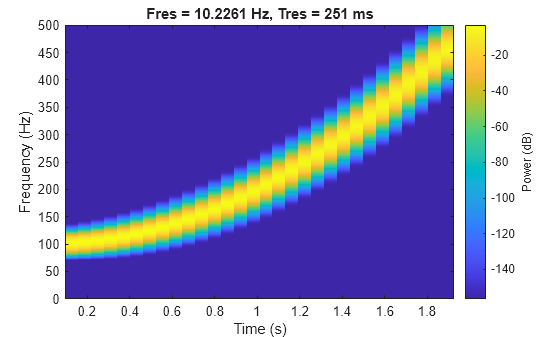
Extract Features from Signal
Consider a quadratic chirp sampled at 1 kHz for 2 seconds. The chirp has an initial frequency of 100 Hz that increases to 200 Hz at t = 1 second. Compute and display the spectrogram.
fs = 1e3;
t = 0:1/fs:2;
y = chirp(t,100,1,200,'quadratic');
pspectrum(y,fs,'spectrogram')
Create a signalFrequencyFeatureExtractor object to obtain the mean and median frequencies from the signal. Specify the sample rate.
sFE = signalFrequencyFeatureExtractor(SampleRate=fs,MeanFrequency=true,MedianFrequency=true);
Extract the features. info returns the column index in features of each extracted feature.
[features,info] = extract(sFE,y)
features = 1×2

  226.0160  199.7034
info = struct with fields:
      MeanFrequency: 1
    MedianFrequency: 2
Set the FrameSize and FrameRate properties of the feature extractor object to divide the signal into two frames. The first frame represents the chirp oscillating at the initial frequency of 100 Hz and the second frame represents the chirp oscillating at 200 Hz. Extract the mean and median frequencies for each frame and include the frame limits in the output.
sFE.FrameSize = round(length(y)/2);
sFE.FrameRate = 1000;
[features,info,framelimits] = extract(sFE,y)
features = 2×2

  131.4921  124.9820
  331.2664  324.6992
info = struct with fields:
      MeanFrequency: 1
    MedianFrequency: 2
framelimits = 2×2

           1        1001
        1001        2001
Input Arguments
Output Arguments
Version History
Introduced in R2021b
You can also select a web site from the following list:
Americas
- América Latina (Español)
- Canada (English)
- United States (English)
Europe
- Belgium (English)
- Denmark (English)
- Deutschland (Deutsch)
- España (Español)
- Finland (English)
- France (Français)
- Ireland (English)
- Italia (Italiano)
- Luxembourg (English)
- Netherlands (English)
- Norway (English)
- Österreich (Deutsch)
- Portugal (English)
- Sweden (English)
- Switzerland
- United Kingdom (English)