Logging Intervals
This example shows how to specify logging intervals. Simulink® limits the data logging to the specified intervals.
Open Example Model
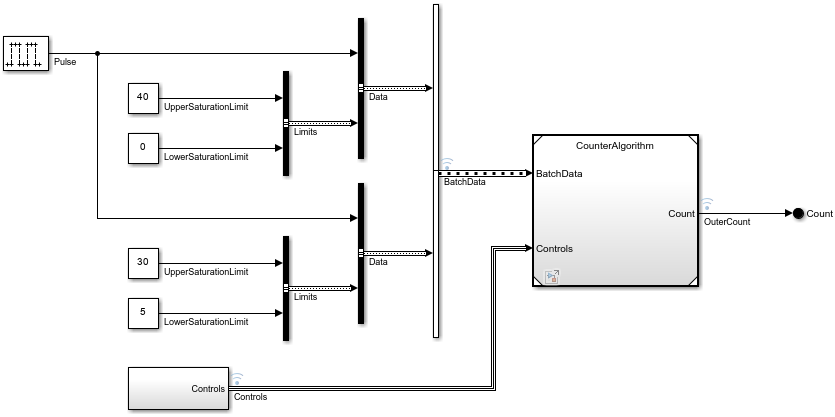
Open the IterativeCounter project. The project opens the CounterSystem model at startup.
openProject("IterativeCounter");To update the line styles, update the model. On the Modeling tab of the Simulink Toolstrip, click Update Model. You can use the line styles to visually identify buses. Alternatively, in the MATLAB® Command Window, enter these commands.
mdl = "CounterSystem";
set_param(mdl,SimulationCommand="update")
Set Logging Intervals
To reduce the amount of logged data, limit data logging to specific simulation time intervals. In this example, you specify two intervals to log the data of two system events triggered by the Increment and Reset signals in the Controls bus. The first interval captures the first reset event. The second interval captures the behavior of the system after the increment event takes place and the signals reach the lower saturation limits. The intervals are based on the Increment and Reset signal values.
To set the Logging Intervals configuration parameter, in the Simulink Toolstrip, on the Modeling tab, click Model Settings. In the Configuration Parameters dialog box, on the Data Import/Export tab, enable the Logging Intervals parameter by selecting Single simulation output.
The Logging Intervals parameter value must be a real double matrix with two columns. The matrix elements must not be NaN. Each row defines the start and end times for an interval. Intervals must be disjoint and ordered. For this example, set Logging Intervals to [9,10.5;14.5,30].
Alternatively, to store the configuration for the simulation separate from the model, create a Simulink.SimulationInput object with the desired model settings.
simIn = Simulink.SimulationInput(mdl);
simIn = setModelParameter(simIn,ReturnWorkspaceOutputs="on", ...
    LoggingIntervals="[9,10.5;14.5,30]");
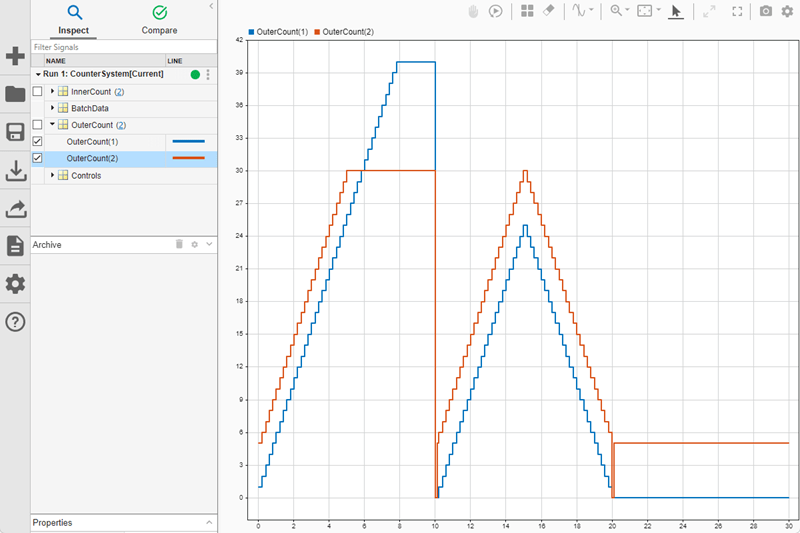
Simulate the Model and View Results
Simulate the model using the configuration stored in the Simulink.SimulationInput object named simIn.
out = sim(simIn);
Logging intervals do not apply to all logging techniques. For example, specified logging intervals do not apply to data that is streamed to the Simulation Data Inspector.
The Logging intervals parameter does apply to logging techniques such as:
Time, states, and output logging
Signal logging
Data logged using the To Workspace block
Data logged using the To File block
Data logged to the workspace using the Record block
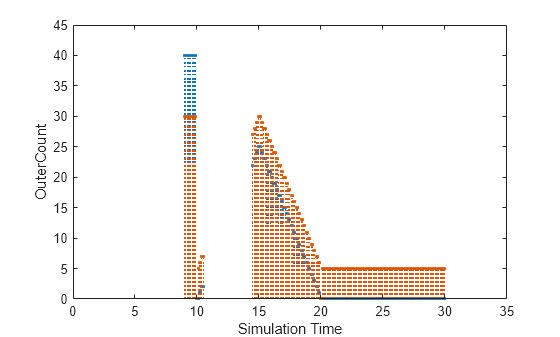
For example, the data logged to the workspace using signal logging does honor specified logging intervals. OuterCount is a wide signal with two elements. To display the logged values of OuterCount captured as part of signal logging, use the stem function, which ignores the interpolation settings of the data.
time = out.get("logsout").get("OuterCount").Values.Time;
data = out.get("logsout").get("OuterCount").Values.Data;
stem(time,data,":.");
xlabel("Simulation Time");
xlim([0 35]);
ylabel("OuterCount");
ylim([0 45]);