Post-Process Real-time Signals Streamed to the Simulation Data Inspector
This example shows how to use a Simulink® Real-Time™ log of signal data and the Simulation Data Inspector. Signals are logged during model execution. At the end of the run, the Simulation Data Inspector interface displays the signal. This example shows how to get the signals from the Simulation Data Inspector interface for post-processing by using MATLAB® functions.
Create Target Object and Connect
Create a Target object for the default target computer and connect to the target computer. In the Command Window, type:
tg = slrealtime;
connect(tg);
Open, Build, and Download Model
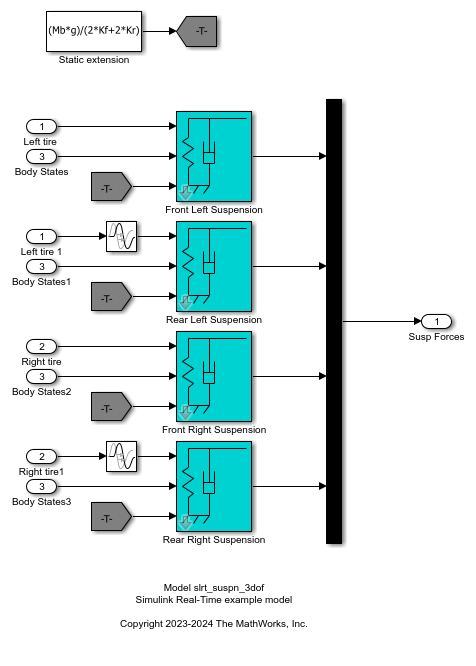
Open the model slrt_suspn_3dof. This model simulates vehicle dynamics based on the interaction between road and suspension for different road profiles. The model captures vehicle dynamics in three degrees of freedom: vertical displacement, roll, and pitch. The Signal Editor block stores measured road profile data for the left and right tires as different test groups. The Road-Suspension Interaction subsystem calculates the suspension forces on the vehicle at the four tire locations based on the road data and the current vehicle state. The Body Dynamics subsystem uses these forces and the resulting pitch and roll moments to calculate the vehicle motion in each of the three degrees of freedom.
Open the model.
model = 'slrt_suspn_3dof';
open_system(model);
modelSTF = getSTFName(tg);
set_param(model,"SystemTargetFile",modelSTF);
set_param(model,'RTWVerbose','off');
Build the model:
evalc('slbuild(model)');
Close the model it is open.
bdclose(model);
Run Model to Calculate the Vertical Vehicle Displacement
Using the Target object, tg, load the real-time application, modify application parameters, and start the application.
load(tg,model);
setparam(tg,'','Cf',125);
start(tg);
while ~strcmp(tg.status,'stopped')
    pause(5);
end
stop(tg);
Warning: Unable to instrument 'SigGen': Unable to find signal 'SigGen' in
application.
Warning: Unable to instrument 'XfrFnc': Unable to find signal 'XfrFnc' in
application.
Update Parameters and Re-calculate the Vertical Vehicle Displacement
Using the Target object, tg, load the real-time application, modify application parameters, and start the application.
load(tg,model);
setparam(tg,'','Cf',2375);
start(tg);
while ~strcmp(tg.status,'stopped')
    pause(5);
end
stop(tg);
Warning: Unable to instrument 'SigGen': Unable to find signal 'SigGen' in
application.
Warning: Unable to instrument 'XfrFnc': Unable to find signal 'XfrFnc' in
application.
Display Signals in Simulation Data Inspector
To view the plotted signal data, open the Simulation Data Inspector.
Simulink.sdi.view
Retrieve and Plot Signal Data from Simulation Data Inspector
You can also retrieve the signal data from the Simulation Data Inspector and plot (post-process) the data by using these commands.
Get all the runs
Get the run information
Get the signal
Get the signal objects
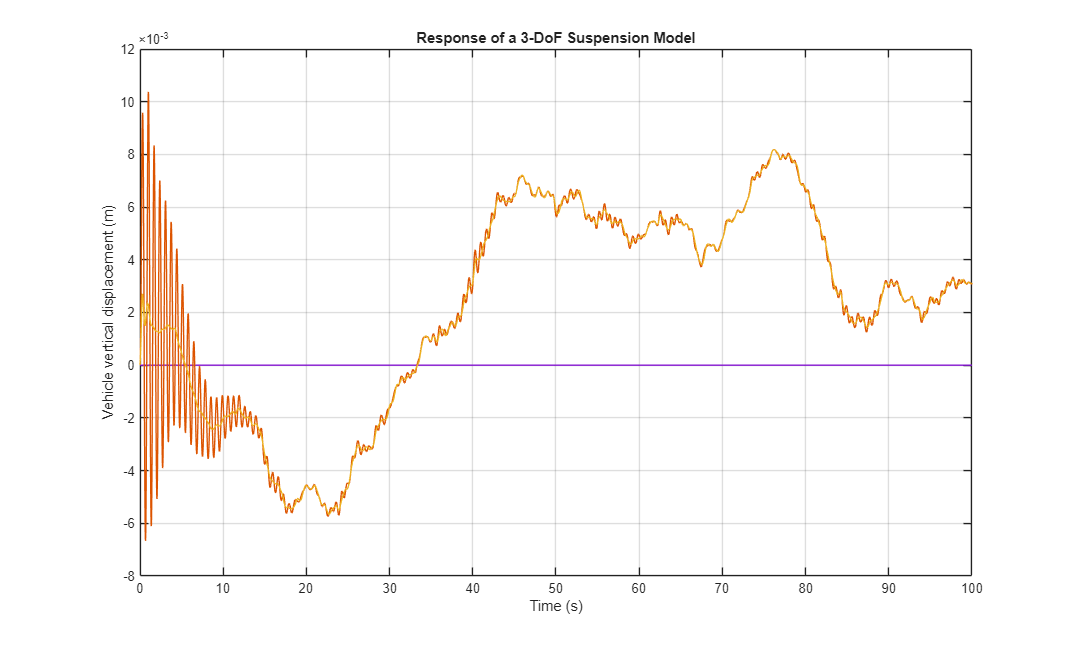
Plot the signals
The result shows the effect on vehicle dynamics from the interaction between road and suspension for different road profiles.
runIds = Simulink.sdi.getAllRunIDs();

for i = 1:length(runIds)
    run = Simulink.sdi.getRun(runIds(i));
    signalID = run.getSignalIDsByName('vertical_disp');
    if ~isempty(signalID)
        signalObj = Simulink.sdi.getSignal(signalID);
        signalArray(:,i) = signalObj.Values(:,1).Data;
        timeValues = signalObj.Values(:,1).Time;
        plot(timeValues,signalArray);
        drawnow;
    end
end

grid on;
title('Response of a 3-DoF Suspension Model');
xlabel('Time (s)'); ylabel('Vehicle vertical displacement (m)');
See Also
slrtTETMonitor | SLRT Overload
Options