Model a Fitness Tracker
This example shows how to create an interface between a Stateflow® chart and a MATLAB® app created in App Designer. For other examples that show how to connect a Stateflow chart to a MATLAB app, see Model a Power Window Controller and Simulate a Media Player. For a version of this example that uses standalone charts in MATLAB, see Model a Fitness App by Using Standalone Charts.
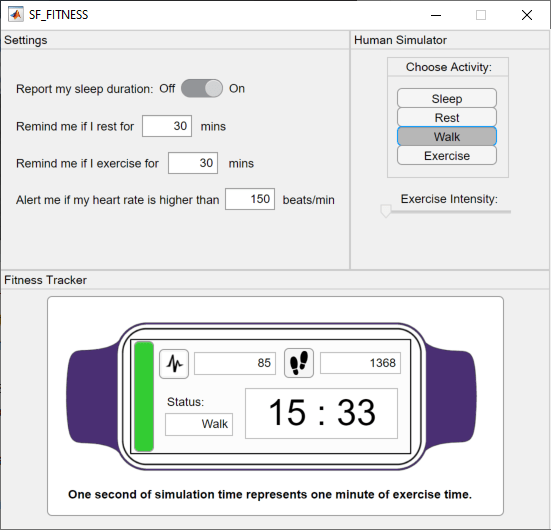
In this example, a MATLAB app models a fitness tracker. During simulation, you can adjust the settings for the tracker and select an activity (Sleep, Rest, Walk, or Exercise). When you choose Exercise, you can also set the intensity of your workout.
The Stateflow chart App Interface provides a bidirectional connection between the MATLAB app and the control and plant systems in the Simulink® model. When you interact with the widgets in the app, the chart communicates your selections to the other charts in the model. Conversely, the chart uses the output of the fitness tracker to update the numeric and text fields in the app. For example, when you click the Rest button on the app, the App Interface chart sets the value of the output activity to the enumerated value Activity.Rest. The Human Simulator chart responds by producing vital sign values that model a person at rest. The Fitness Tracker chart analyses these values and sets the output signal status to Activity.Rest. The App Interface chart monitors this signal and updates the contents of the Status field in the app to Rest.
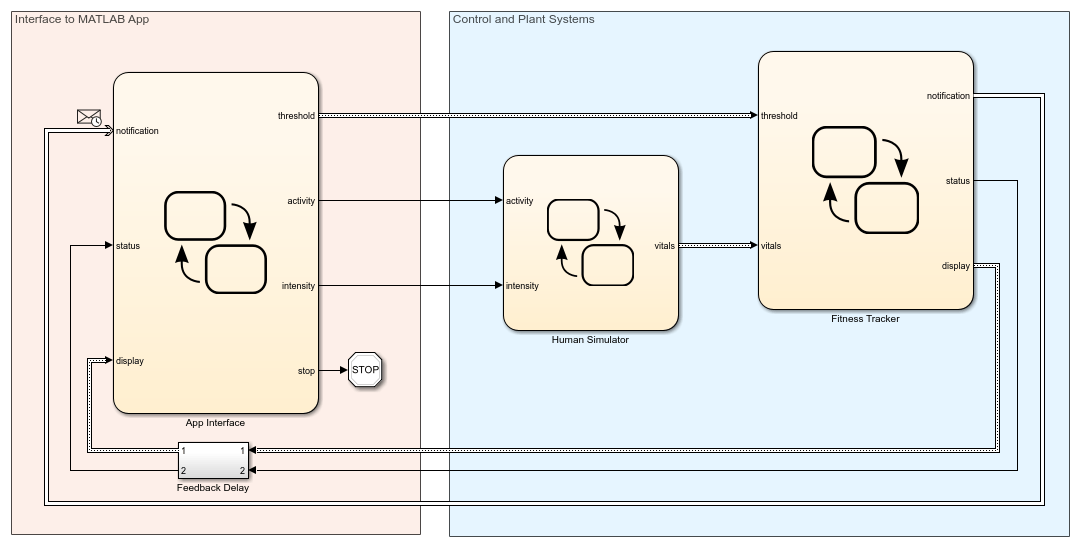
To run the example, open the Simulink model and click Run. The chart App Interface opens the app and initializes the Human Simulator and Fitness Tracker charts. While the example is running, one second of simulation represents one minute of exercise time. To stop the simulation, click Stop or close the app.
Connect Chart to MATLAB App
The chart App Interface is configured to communicate with the MATLAB app sf_fitness_app.
The app uses a property called
chartto interface with the chartApp Interface. The app callbacks use this property to read the chart inputs and write to the chart outputs. For example, when you change the value of one of the fields in the Settings pane, a callback updates the value of the corresponding field of the output structurethreshold. Similarly, when you select a new activity or change the intensity of your workout in the Human Simulator pane, a callback sets the value of the chart outputsactivityandintensity. Finally, when you close the app, theUIFigureCloseRequestcallback sets the value of the chart outputstoptotrue.In the chart, the entry actions in the
InterfaceWithAppstate run the appsf_fitness_appand store the returned value as the local data objectapp. The chart uses this local data object when it calls the helper functionsupdateStatus,updateClock,updateText,updateSteps, andupdateHeartRate. In the app, these helper functions change the contents of the activity status, clock, and step counter fields, and create the animation effects in the heartbeat and footstep displays. For example, when the chart receives anotificationmessage, the substateMainDisplaycalls the helper functionupdateText. This function replaces the contents of the clock display with a customized notification. After five seconds, the substate calls the helper functionupdateClockto restore the clock display.
For more information on how to create a bidirectional connection between your MATLAB app and a Stateflow chart, see Model a Power Window Controller and Simulate a Media Player.
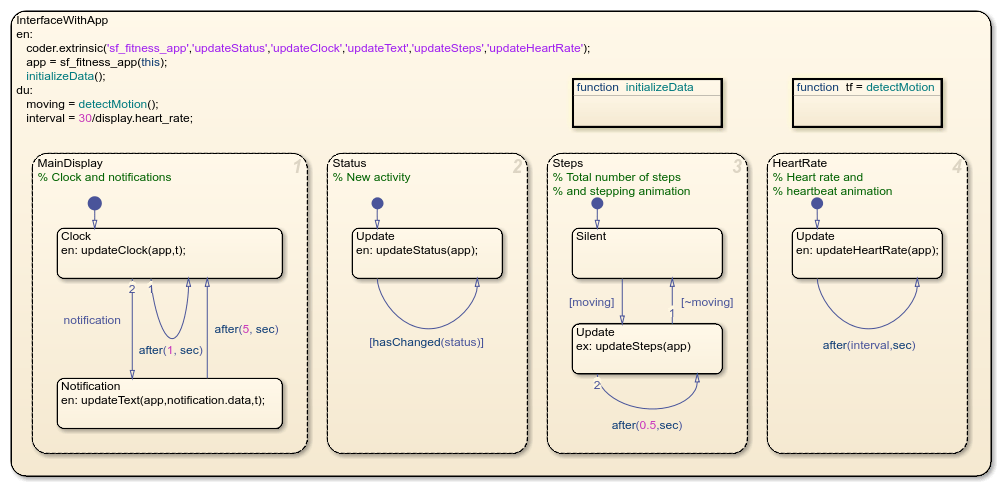
The functions used to interact with the app are not supported for code generation, so the InterfaceWithApp state first calls the coder.extrinsic function to declare them as extrinsic MATLAB code. For more information, see Call Extrinsic MATLAB Functions in Stateflow Charts.
Simulate Vital Signs Based on Activity
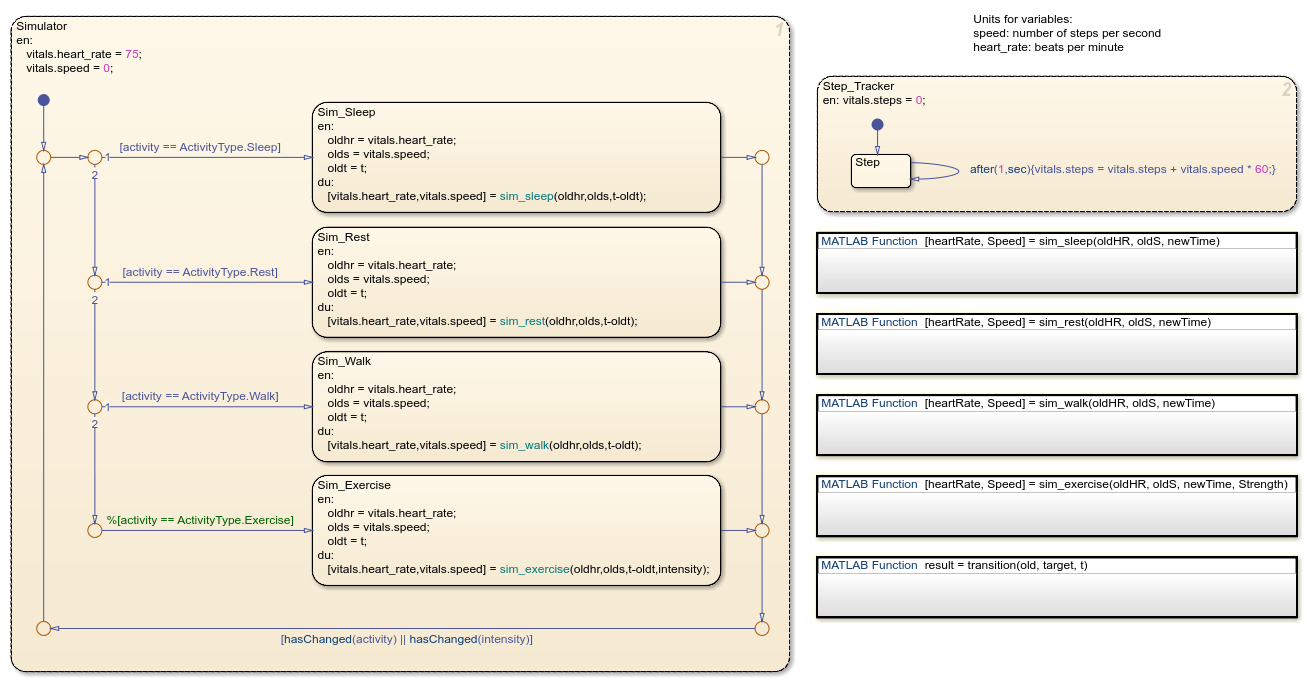
The Human Simulator chart models the vital signs of a human engaged in the activity you select in the app. The chart uses the output structure vitals to relay these vital signs to the fitness tracker. The fields of the structure represent your heart rate, speed, and the number of steps that you have taken. When you select a new activity or adjust the intensity of your workout, the chart calls the function transition to ensure that these vital signs change gradually over time. To detect changes in activity or exercise intensity, the chart calls the hasChanged operator. For more information, see Detect Changes in Data and Expression Values.
Determine Fitness Tracker Output
The chart Fitness Tracker models the core logic of the fitness tracker. The chart consists of four subcharts that correspond to the possible activities. The chart registers your activity status based on the heart rate and speed produced by the Human Simulator chart and transitions between these subcharts. To filter out signal noise, the chart uses the duration operator to implement simple debouncing logic. For instance, when you are at rest, you can make some quick and sudden movements that do not correspond to exercise. The chart determines that you are walking or exercising only if your motion lasts longer than two minutes (or two seconds of simulation time). The chart monitors the active child state and passes this information to the App Interface chart through the output data status. For more information, see Monitor State Activity Through Active State Data.
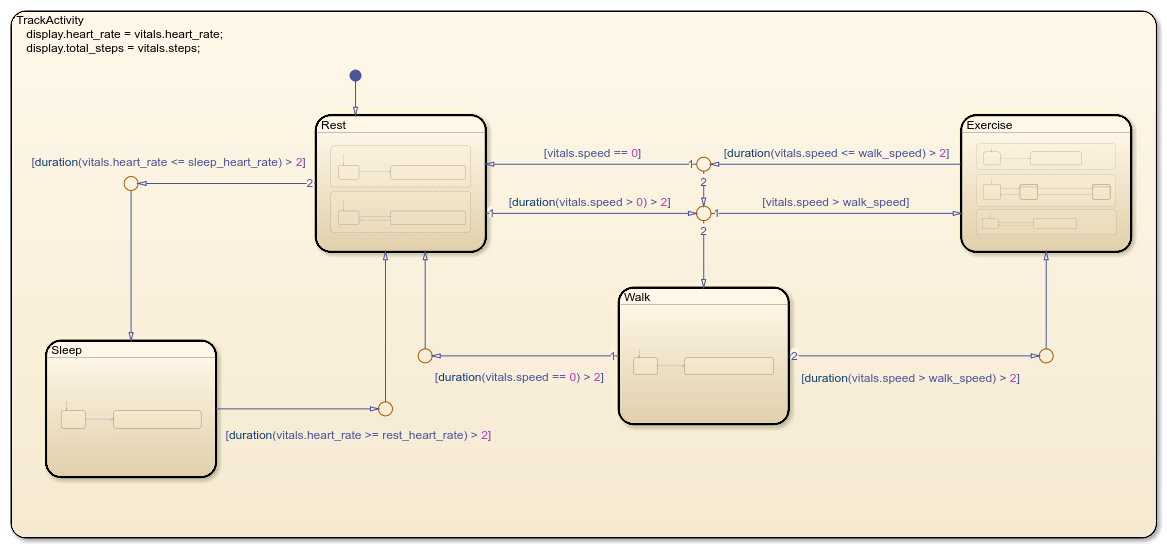
The chart uses other temporal logic operators to track the amount of time you spend in each activity and determine when to send notifications to the app:
The exit actions in each subchart call the
elapsedoperator to determine how long the subchart was active. The chart communicates this value, along with other information such as your heart rate and your total number of steps, to theApp Interfacechart through the output structuredisplay.The chart uses the
afteroperator to determine when you sleep or walk for longer than five minutes, rest or exercise for longer than the threshold you specify in the app, or exercise at a high intensity (taking more than 4 steps a second) for longer than 15 minutes. In each of these cases, the chart sends aNotificationmessage. TheApp Interfacechart receives this message and causes a notification to appear in the main display of the app. Depending on the type of notification, the notification button changes color.
See Also
Stop Simulation (Simulink) | after | duration | elapsed | hasChanged | coder.extrinsic (MATLAB Coder)
Related Topics
You can also select a web site from the following list:
Americas
- América Latina (Español)
- Canada (English)
- United States (English)
Europe
- Belgium (English)
- Denmark (English)
- Deutschland (Deutsch)
- España (Español)
- Finland (English)
- France (Français)
- Ireland (English)
- Italia (Italiano)
- Luxembourg (English)
- Netherlands (English)
- Norway (English)
- Österreich (Deutsch)
- Portugal (English)
- Sweden (English)
- Switzerland
- United Kingdom (English)