polytool
Interactive polynomial fitting
Syntax
polytool(x,y)

polytool(x,y,n)

polytool(x,y,n,alpha)

polytool(x,y,n,alpha,xname,yname)

h = polytool(...)
Description
polytool(x,y) fits a line
to the vectors x and y and displays
an interactive plot of the result in a graphical interface. You can
use the interface to explore the effects of changing the parameters
of the fit and to export fit results to the workspace.
polytool(x,y,n) initially
fits a polynomial of degree n. The default is 1,
which produces a linear fit.
polytool(x,y,n,alpha) initially
plots 100(1 - alpha)%
confidence intervals on the predicted values. The default is 0.05 which
results in 95% confidence intervals.
polytool(x,y,n,alpha,xname,yname) labels
the x and y values on the graphical
interface using xname and yname.
Specify n and alpha as [] to
use their default values.
h = polytool(...) outputs
a vector of handles, h, to the line objects in
the plot. The handles are returned in the degree: data, fit, lower
bounds, upper bounds.
Examples
Interactive polynomial fitting
This example shows how to start an interactive
fitting session with polytool.
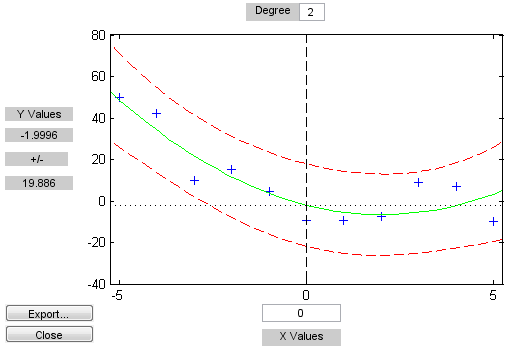
Generate data from a quadratic curve with added noise.
rng('default') % for reproducibility
x = -5:5;
y = x.^2 - 5*x - 3 + 5*randn(size(x));
Fit a quadratic (degree-2) model with 0.90 confidence
intervals.
n = 2;
alpha = 0.1;
polytool(x,y,n,alpha)
Version History
Introduced before R2006a