Receive and Visualize CAN FD Data Using CAN FD Explorer
This example shows how to use the CAN FD Explorer app to receive and visualize CAN FD data.
It uses MathWorks® Virtual channels which are connected in a loopback configuration. CAN FD Explorer is configured to receive data using MathWorks Virtual 1 Channel 1. Pre-recorded data is provided in a MAT-file and replayed onto MathWorks Virtual 1 Channel 2 to emulate CAN FD traffic generated from connecting to an actual vehicle system.
Open CAN FD Explorer
Open the CAN FD Explorer app using command canFDExplorer. Alternatively, you can find CAN FD Explorer in the MATLAB® Apps tab.
Select the Device Channel
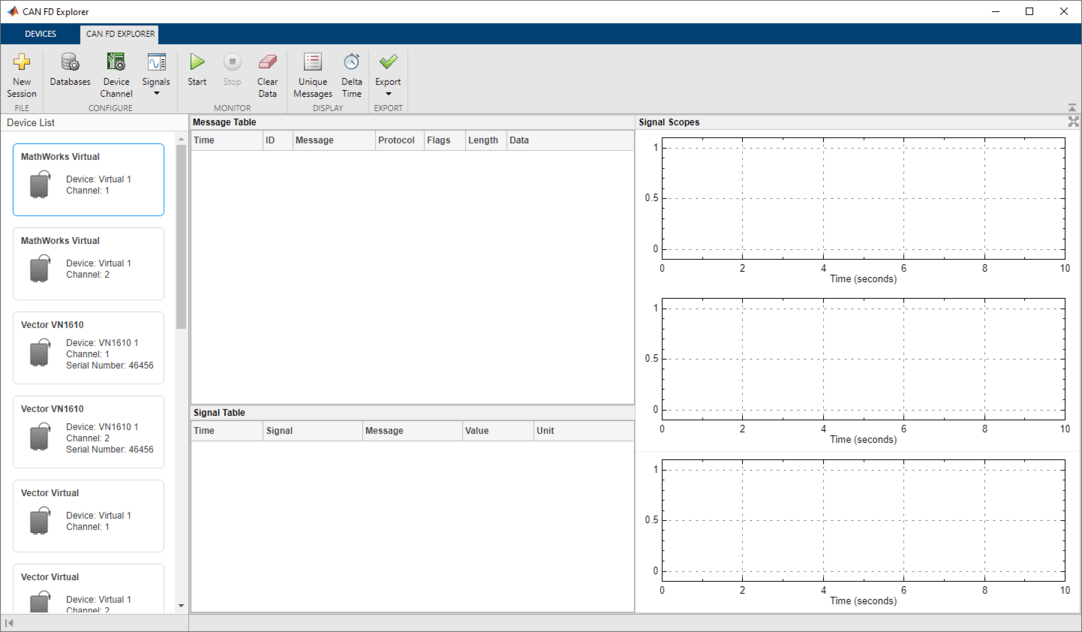
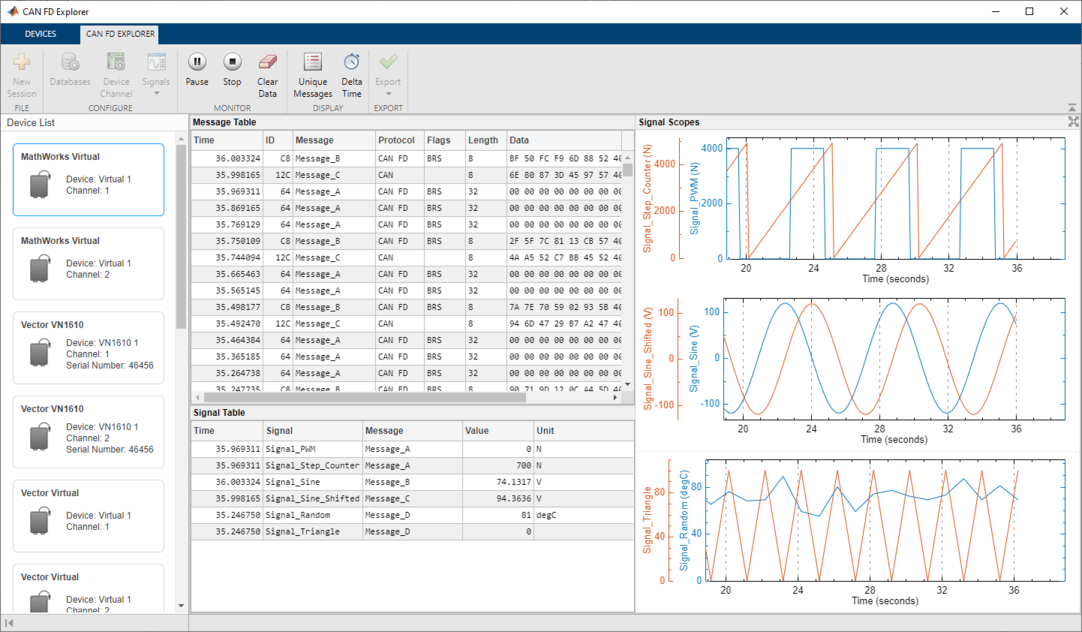
When the app first opens, it displays all the accessible CAN FD channels from devices connected to the system. Select MathWorks Virtual 1 Channel 1 from the available devices. Then the app finishes opening and looks like this, with the selected device highlighted in a blue outline.
Configure the Database Files
Add database files to CAN FD Explorer to decode incoming messages and signals.
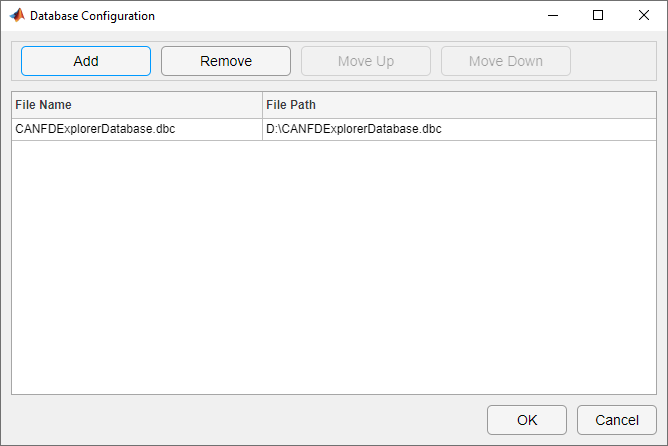
To open the Database Configuration dialog, select Databases in the toolstrip.
Click Add to open the file selection dialog. Select the
CANFDExplorerDatabase.dbcfile provided with the example.Click OK to save the database configuration and close the dialog.
Configure the Channel Bus Speed
Configure the channel bus speed if the desired network speed differs from the default value.
To open the Device Channel Configuration dialog, select Device Channel in the toolstrip.
This example uses the default arbitration bus speed at 500000 bits per second and data bus speed at 2000000 bits per second. Confirm the current device channel configuration and click OK.
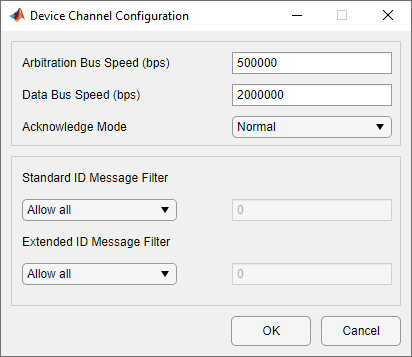
In the same dialog, you can configure message filters respectively for standard ID and extended ID to control which messages pass through the channel. By default, both filter options are set to allow all messages to pass, but you can also specify certain IDs to be allowed or blocked.
Configure the Signal Table
Add signals of interest to view on the Signal Table. In this example, you view all signals defined in the CANFDExplorerDatabase.dbc file.
To open the Signal Table Configuration dialog, select Signals > Configure Signal Table in the toolstrip.
Add signals from the Available Signals pane to the Configured Signals pane using the → button. You can add individual signals, add all signals in a message by adding the message, or add all signals in a database by adding the database. For this example, select
CANFDExplorerDatabase.dbcin the Available Signals pane and click → to add all signals in the database to view.Click OK to save the signal table configuration and close the dialog.
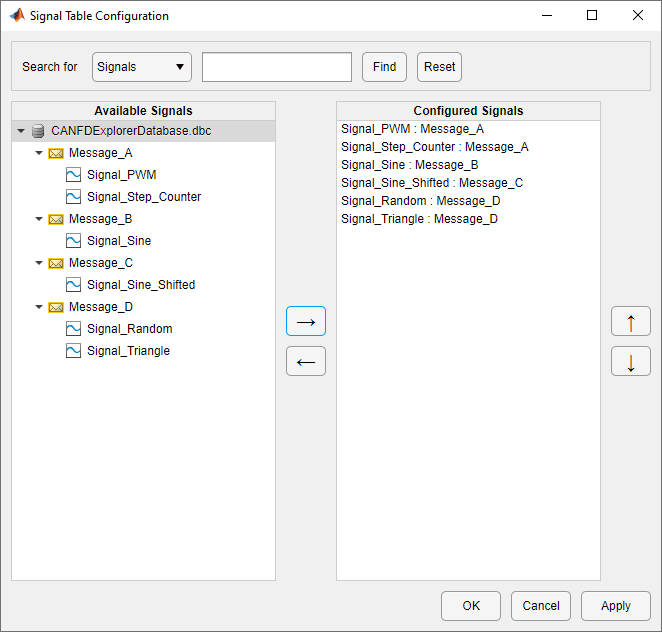
If you provide a search text for signals or messages and click Find, the Available Signals pane is updated to display search results that are case-insensitive partial matches to the search text.
Configure the Signal Scopes
Add signals of interest to view on the Signal Scopes. CAN FD Explorer provides 3 scopes that can each be configured to visualize signals of selection. The number of scopes is fixed and cannot be customized. In this example, you view all signals from Message_A in the top signal scope, all signals from Message_B and Message_C in the middle signal scope, and all signals from Message_D in the bottom signal scope.
To open the Top Signal Scope Configuration dialog, select Signals > Configure Top Signal Scope in the toolstrip.
Select
Message_Ain the Available Signals pane and click → to add all signals in this message to view on the top signal scope.Click OK to save the top signal scope configuration and close the dialog.
Using a similar approach, add signals from
Message_BandMessage_Cto view on the middle signal scope, and add signals fromMessage_Dto view on the bottom signal scope.
Start Monitoring
Start monitoring in CAN FD Explorer before starting the replay to avoid losing any data. Click Start in the toolstrip.
Replay Pre-Recorded CAN FD Data
Data logged from a CAN FD network is provided in the file CANFDExplorerData.mat. The data is saved in timetable format and the time range spans about 60 seconds.
Replay the CAN FD data onto MathWorks Virtual 1 Channel 2 for CAN FD Explorer to receive on MathWorks Virtual 1 Channel 1 in the same MATLAB instance. To start the data replay, execute the script replayCANFDData.m. You can also execute the script sequentially multiple times to generate CAN FD data beyond 60 seconds for additional experiments.
Explore the Monitor and Display Options
While CAN FD Explorer continues to receive data, you can experiment with controls in the Monitor and Display sections of the toolstrip.
Click Pause to temporarily suspend CAN FD Explorer from visually updating. While paused CAN FD Explorer continues accumulating and processing data in the background.
Click Continue to resume the visual updates in CAN FD Explorer.
For further exploration:
If you click Clear Data, all accumulated data is completely cleared from CAN FD Explorer.
By default, the Message Table displays all CAN FD messages in chronological order. To view the latest instance of each unique message, toggle Unique Messages.
By default, both the Message Table and the Signal Table display time since the start of monitoring. To view the delta time since the last message or signal in each table, toggle Delta Time.
Stop Monitoring
When you have completed your live acquisition activity, click Stop in the toolstrip to take the device channel offline.
Clean up for the Data Replay
Clean up by executing the script replayCANFDDataCleanup.m, which stops the MathWorks Virtual 1 Channel 2 used for replay and clears the unneeded variables.
Export Data for Additional Use
In the toolstrip, click the top half of the Export button to export the received data into the MATLAB workspace in a timetable format.
If you would like to retain the exported variable for future use:
To save the variable to a MAT-file, use the
savefunction.To save the variable to a BLF file, use the
blfwritefunction.
The exported timetable of messages is also convertible into individual timetables of signal data. The canSignalTimetable function returns a structure with one field for each unique message in the timetable. Each field value is a timetable of all the signals defined in that message.