Finding the point of intersection of a single-loop line of best fit from my data?
17 views (last 30 days)
Show older comments
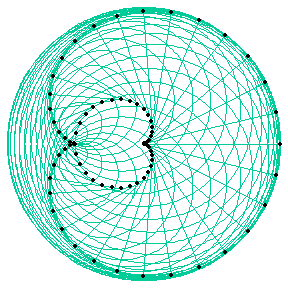
I have data points recorded and have plotted a curve through the points in 2D. It forms a kind of cardioid, with a smaller loop in the middle, a little like the one pictured .

How can I find the point of intersection of the line with itself? I cannot plot the mode because the points are fairly high resolution so none are exactly the same. Do I need to map the points as a function (and if so how?) or can I do it with the raw data?
2 Comments
John D'Errico
on 9 Feb 2019
What you do not say is if the curve actually self-intersects, or if it merely touches at that point.
The difference is significant. If the curve crosses itself in 2-d, you can use Doug Schwarz's intersections tool, found on the File Exchange to locate the point where it crosses itself. That tool can be used to search for self-intersections.
If the point where those lobes seem to touch is actually a point of reflection, then that point will be more difficult to locate, since all you can do is interpolate. As such, the interpolated curve may not actually intersect at a nice point.
And without the data itself, it is difficult to know which of these cases is the truth.
Answers (1)
John D'Errico
on 10 Feb 2019
I guess I don't see what is the problem. If the curve self-intersects, AND you have a list of points that define the curve, then just use intersections, provided by Doug Schwarz. It is on the File Exchange. I think I said that.
Since I have no more than a picture of your data, a made up example must suffice.
t = linspace(0,2*pi,20);
x = sin(2*t + pi/4);
y = cos(3*t);
[xint,yint] = intersections(x,y);
[xint,yint]
ans =
-0.67804 0.0083699
-0.48462 0.35402
-0.47484 -0.34641
-0.25058 -0.011686
0.4541 -0.87947
0.48828 0.83007
0.70711 1
0.92403 0.060829
plot(x,y,'b-',xint,yint,'r*')

There are clearly 7 points of intersection, all shown with the red stars. It looks like it also found the first point on the curve, since that also happens to be the last point as I created it. Intersections uses linear interpolation. But that should be entirely sufficient, since your data is quite closely spaced.
0 Comments
See Also
Categories
Find more on Annotations in Help Center and File Exchange
Community Treasure Hunt
Find the treasures in MATLAB Central and discover how the community can help you!
Start Hunting!