
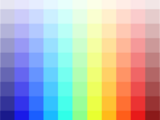
Maximally Distinct Color Generator
Generate maximally-distinct colors in an RGB colormap.
of 24 bit TrueColor, allowing for neat and simple vectorized MATLAB code.These two motivations are closely linked to two non-trivial tasks that have to be solved in order to generate maximally-distinct
- 2.3K (All time)
- 18 (Last 30 days)
- 5.0 / 5
- Community
-
1 Apr 2026
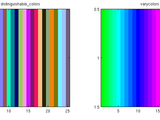
Generate maximally perceptually-distinct colors
Choose a set of n colors that can be readily distinguished from each other
When plotting a set of lines, you may want to distinguish them by color. By default, Matlab chooses a small set of colors and cycles among them, and so if you have more than a few lines there will be
- 36.7K (All time)
- 53 (Last 30 days)
- 4.9 / 5
- Community
-
7 Feb 2011

ColorBrewer: Attractive and Distinctive Colormaps
The complete palette of ColorBrewer colormaps. Simple selection by scheme name and map length.
BREWERMAP Function==================[
Lattice Boltzmann N-phase model with MRT and Enhanced Equilibrium (LBM)
Another starting point for newcomers wanting to study RK-type lattice Boltzmann model.
N, the distribution functions of each color are not required [R1]. Variable density ratios are achieved with enhanced equilibrium distribution functions [R2]. The multiple-relaxation-time collision
- 1.2K (All time)
- 2 (Last 30 days)
- 5.0 / 5
- Community
-
6 Feb 2015

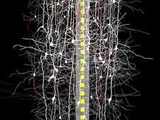
Simulate Control of Magnetized Tetrahymena Pyriformis Cells
With uniform magnetic field uses control-Lypunov function to steer all cells to orbit goal positions
- 724 (All time)
- 1 (Last 30 days)
- 5.0 / 5
- Community
-
31 Jul 2013

Violin Plots for plotting multiple distributions (distributionPlot.m)
Function for plotting multiple histograms side-by-side in 2D - better than boxplot.
: countEntries, colorCode2rgb, isEven, myErrorbarIf you want to overlay individual data points, you need to download the separate submission plotSpread
- 14.8K (All time)
- 11 (Last 30 days)
- 5.0 / 5
- Community
-
11 Feb 2017

- 758 (All time)
- 5 (Last 30 days)
- 5.0 / 5
- Community
-
30 Sep 2021
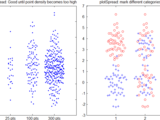
plot spread points (beeswarm plot)
plotSpread plots distributions of data points, adding jitter to the points to avoid overlap.
- 12.8K (All time)
- 9 (Last 30 days)
- 4.9 / 5
- Community
-
11 Feb 2017

DynaSim simplifies the process of building and simulating models of dynamical systems.
- 1.3K (All time)
- 1 (Last 30 days)
- 4.9 / 5
- Community
-
17 Feb 2022
- 605 (All time)
- 3 (Last 30 days)
- 5.0 / 5
- Community
-
20 Jun 2021

- 1.9K (All time)
- 67 (Last 30 days)
- 5.0 / 5
- Community
-
9 May 2024

- 127 (All time)
- 2 (Last 30 days)
- 5.0 / 5
- Community
-
30 Apr 2019

- 481 (All time)
- 5 (Last 30 days)
- 5.0 / 5
- Community
-
23 Jul 2020

MATLAB & Bash Scripts for localizing and interactivity visualizing intracranial electrode data
- 855 (All time)
- 3 (Last 30 days)
- 5.0 / 5
- Community
-
11 Jun 2022

Polytope bounded order-2 Voronoi diagram in 2D/3D
The function creates arbitrary polytope bounded order-2 Voronoi diagram in 2D/3D
maximally perceptually distinct. The function is written by Timothy E. Holy.
- 653 (All time)
- 3 (Last 30 days)
- 4.5 / 5
- Community
-
3 Jun 2020

- 3.3K (All time)
- 2 (Last 30 days)
- 4.5 / 5
- Community
-
29 Jan 2018

- 2.8K (All time)
- 7 (Last 30 days)
- 4.4 / 5
- Community
-
15 Mar 2023

colorSpectrum: Create N Distinct Plot Colors
Creates N distinct three-element RPB vectors for plotting
For a consistent plot lines coloring scheme. Returns a color spectrum from red to green to blue. Avoids colors that are hard to see in matlab plots, such as yellow and cyan.Three Easy
- 580 (All time)
- 1 (Last 30 days)
- -- / 5
- Community
-
4 Dec 2013
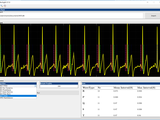
BioSigKit a toolkit for Bio-Signal analysis
BioSigKit is a set of useful signal processing tools for Biosignal analysis such as QRS detectors, peak detectors and activity detection
- 3K (All time)
- 5 (Last 30 days)
- 4.0 / 5
- Community
-
18 Oct 2018

Sunburst or Polar Treemap Plot and Range Plot
Visualize data as sunburst/polar treemap plot or range plot
- 322 (All time)
- 5 (Last 30 days)
- 4.0 / 5
- Community
-
6 Sep 2020

- 51 (All time)
- 1 (Last 30 days)
- -- / 5
- Community
-
22 May 2024

Feedback Control of Many Differential-Drive Robots with Uniform Control Inputs
GAS feedback control for many differential-drive robots when each robot receives same control inputs
- 1K (All time)
- 1 (Last 30 days)
- -- / 5
- Community
-
27 Sep 2012

- 422 (All time)
- 2 (Last 30 days)
- -- / 5
- Community
-
26 Oct 2017

Empirical orthogonal function (PCA) estimation for EEG time series
Empirical orthogonal function (PCA) estimation for EEG time series
- 1K (All time)
- 1 (Last 30 days)
- -- / 5
- Community
-
27 Jun 2013
- 124 (All time)
- 2 (Last 30 days)
- -- / 5
- Community
-
28 May 2024
- 490 (All time)
- 4 (Last 30 days)
- -- / 5
- Community
-
26 Nov 2020
- 96 (All time)
- 1 (Last 30 days)
- -- / 5
- Community
-
28 Mar 2017
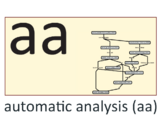
aa is a comprehensive pipeline system for neuroimaging written in MATLAB to facilitate automatic, flexible, and replicable analyses.
- 76 (All time)
- 1 (Last 30 days)
- -- / 5
- Community
-
14 Aug 2023

- 39 (All time)
- 1 (Last 30 days)
- -- / 5
- Community
-
12 Mar 2021
- 317 (All time)
- 2 (Last 30 days)
- -- / 5
- Community
-
11 Jun 2018

Bayesian spatial propensity score matching. This is an update of the original code I made in 2014, now updated to run in MatLab 2020a
- 126 (All time)
- 1 (Last 30 days)
- -- / 5
- Community
-
9 Jan 2022

Approximate Tverberg Point in 2D and 3D
Given n points in R^d the function calculates Tverberg partition of max. depth in Linear time
. http://www.mathworks.com/matlabcentral/fileexchange/30892-representing-polyhedral-convex-hulls-by-vertices-or--in-equalities/content/vert2lcon.m"distinguishable_colors.m" picks colors that are maximally perceptually distinct. The function is written by Timothy E. Holy.
- 141 (All time)
- 2 (Last 30 days)
- -- / 5
- Community
-
3 Jun 2020

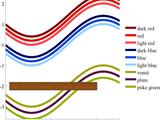
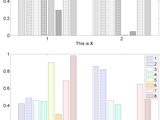
Creates a palette with up to 12 colors that are easy to distinct everywhere (print, screen, B&W), for everyone (color-blindness) and pretty.
The colors created by Paul Tol at SRON are good for publication-quality figures:https://personal.sron.nl/~pault/- distinct for all people, including color-blind readers- distinct from black and white
- 248 (All time)
- 5 (Last 30 days)
- -- / 5
- Community
-
3 Feb 2019
ColorSelect for Loop-Based Plotting
Provides up to 125 colors, with the goal of keeping adjacent colors distinct.
ColorSelect provides a pseudorandomized color vector for an input between 1 and 125. Higher or negative numbers will repeat. All colors will not be distinct.Calling ColorSelect with no argument
- 48 (All time)
- 1 (Last 30 days)
- -- / 5
- Community
-
8 Feb 2016

Use the cubehelix algorithm to generate colormaps suitable for grayscale conversion
for published or distributed documents as they are very attractive in full color and yet are suitable for grayscale conversion.CUBEHELIX creates different colormaps using just a few parameters. The
- 4.5K (All time)
- 9 (Last 30 days)
- 4.9 / 5
- Community
-
31 Mar 2026

Convert between RGB and Color Names
RGB to color name. Color name to RGB. Supports many palettes: CSS, dvips, HTML, MATLAB, RAL, SVG, X11, xcolor, xkcd,...
One function converts between RGB and color names, in both directions.The function COLORNAMES accepts either RGB values or color names as its inputs, and returns the color names and RGB values from
- 3.3K (All time)
- 16 (Last 30 days)
- 5.0 / 5
- Community
-
31 Mar 2026

Color segmentation by Delta E color difference
User draws region and this finds pixels in the image with a similar color, using Delta E.
Demo to perform very, very simple color detection in LAB color space. The RGB image is converted to LAB color space and then the user draws some freehand-drawn irregularly shaped region to identify a
- 13.4K (All time)
- 5 (Last 30 days)
- 4.6 / 5
- Community
-
19 Apr 2011
Parse a sentence or any string into distinct "words"
random numeric string of length 1e6, allwords parses it into over 90000 distinct "words" in less than 0.5 seconds.str = round(rand(1,1000000)*10);ticwords = allwords(str,[0 10]);tocElapsed time is 0.455194
- 1.7K (All time)
- 1 (Last 30 days)
- 5.0 / 5
- Community
-
7 Apr 2010
Intuitive RGB color values from XKCD
RGB triplets for 949 colors, by how they're perceived on a computer monitor and their common names.
This function returns the RGB triplet for almost any color. And unlike the way colors are somewhat officially defined (http://en.wikipedia.org/wiki/Web_colors), this data set describes returns
- 4.9K (All time)
- 8 (Last 30 days)
- 4.9 / 5
- Community
-
12 Jun 2017

The frequency image is where the pixel intensity represents the frequency of the same color pixels.
This is a MATLAB implementation of the Color Frequency concept introduced by T. Kashiwagi & S. Oe.With this script, you pick a color image and then it computes the color frequency image. The
- 1.9K (All time)
- 2 (Last 30 days)
- 4.3 / 5
- Community
-
9 Jul 2010
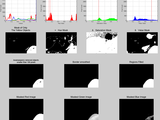
Detect colored regions in an image via thresholding in HSV color space.
This script is a demo that shows you how to find objects of a certain color in an image. For this example I'm using the standard onion, peppers, or kids image that ships with the Image Processing
- 22.7K (All time)
- 7 (Last 30 days)
- 4.4 / 5
- Community
-
19 Dec 2015

cprintf - display formatted colored text in Command Window
Displays sprintf-formatted strings in the Command Window using the specified color/underline/bold style
cprintf command.STYLE colors can be specified in 3 variants: [0.1, 0.7, 0.3] - standard Matlab RGB color format in the range 0.0-1.0 [26, 178, 76] - numeric RGB values in the range 0-255 '#1ab34d
- 29.5K (All time)
- 103 (Last 30 days)
- 4.9 / 5
- Community
-
3 Feb 2026

Fast edges of a color image (actual color, not converting to grayscale)
Edges of a color image by the max gradient method.
Extracts the edges of a color image without converting it to grayscale.Changes in color are detected even when the grayscale color of two pixels are the same. The edge strength is typically greater
- 6K (All time)
- 3 (Last 30 days)
- 4.7 / 5
- Community
-
7 Jul 2010

Drawing Color Histograms and Color Clouds
Matlab code to plot color histograms and color clouds
Usage: createColorHistograms(im_str)im_str can be an image file location or a three-dimensional arrayThere seem to be two confounds in plotting color histograms. One is the obvious one of showing a
- 12K (All time)
- 3 (Last 30 days)
- 5.0 / 5
- Community
-
1 Aug 2010

Electrophysiology data analysis
specific criteria+ Color tag epochs for faster inspection+ Extract features across group of epochsFor more information and to download the latest version visit: https://lucadellasantina.github.io/Clarinet/
- 127 (All time)
- 1 (Last 30 days)
- 5.0 / 5
- Community
-
10 Jan 2020

RGB triple of color name, version 2
Returns a Matlab RGB color specifier corresponding to a given color name (139 colors supported).
RGB = RGB('COLORNAME') returns the red-green-blue triple corresponding to the color named COLORNAME by the CSS3 proposed standard [1], which contains 139 different colors (an rgb triple is a 1x3
- 22.3K (All time)
- 22 (Last 30 days)
- 5.0 / 5
- Community
-
5 Jul 2009
Create tints of colors and colormaps
Create specified tints of colors and colormaps or show examples of tints.To create shades, see http://www.mathworks.com/matlabcentral/fileexchange/47245-color-shades
- 465 (All time)
- 1 (Last 30 days)
- 5.0 / 5
- Community
-
16 Jul 2014

Script to do simple color detection in RGB color space. Finds red objects in the image.
This script is a demo that shows you how to find objects of a certain color in an image. For this example I'm using the standard onion, peppers, or canoe image that ships with the Image Processing
- 21.4K (All time)
- 4 (Last 30 days)
- 4.8 / 5
- Community
-
17 Feb 2018

Create color maps from actual names that people use for colors.
viewers more than 900 of the most commonly-used colors on the internet, and getting users to use their own words to describe that color. The result is a database of the most commonly-used names for colors
- 1.9K (All time)
- 4 (Last 30 days)
- 5.0 / 5
- Community
-
20 Jun 2014

Tracking red color objects using matlab
This program just tracks all red color objects and draws a bounding box around them.
This program just tracks all red color objects and draws a bounding box around them. This works on the difference between frames concept. Every frame in the video is returned as an rgb image on which
- 33.1K (All time)
- 1 (Last 30 days)
- 4.7 / 5
- Community
-
17 Nov 2010
Color Tools for MATLAB is an experimental collection of MATLAB functions related to color science computation and visualization.
Color Tools for MATLAB is an experimental collection of MATLAB functions related to color science computation, color scales, visualization, and ICC color profiles. It is meant to supplement the
- 1.1K (All time)
- 4 (Last 30 days)
- 5.0 / 5
- Community
-
27 Jan 2023
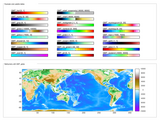
Color Palette Tables (.cpt) for Matlab
Create and apply GMT-style colormaps in Matlab
## cptcmap.m DocumentationAuthor: Kelly Kearney[
Gray image to Color image conversion
Converts a gray image to color image
This program converts a gray image to color image. The conversion is based on color image submitted along with the input gray image. Actualy it transfers color to a grayscale image. The
- 20.8K (All time)
- 3 (Last 30 days)
- 4.2 / 5
- Community
-
22 Apr 2016

Computational Colour Science using MATLAB 2e
Colour toolbox that accompanies the second edition of Computational Colour Science using MATLAB
Colour toolbox that accompanies the second edition of Computational Colour Science using MATLAB (Westland, Ripamonti and Cheung, 2012).Toolbox allows spectral interpolation, calculation of colour
- 9.1K (All time)
- 6 (Last 30 days)
- 4.8 / 5
- Community
-
5 Mar 2013

MATLAB Image Manipulation Toolbox
functionality.Let me know if you find bugs. Highlights:GUI extensions of several core functionsPassthrough/fallback replacements for several IPT toolsMulti-model color picker GUIGUI for parametric color-based mask
- 9.4K (All time)
- 86 (Last 30 days)
- 5.0 / 5
- Community
-
4 Jul 2024
Color name identification: fuzzycolor
Efficient identification of color names for any RGB
Yes, its easy to identify [1, 0, 0] as a red color. But sometimes we want to find ALL colors in an image that we would identify as red. Thus, [1, 0.1, 0.1] is also easily seen as red by the eye. Its
- 5.6K (All time)
- 1 (Last 30 days)
- 4.0 / 5
- Community
-
20 Sep 2006
- 25.1K (All time)
- 13 (Last 30 days)
- 3.5 / 5
- Community
-
3 Jul 2011
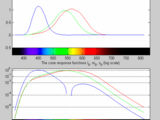
Spectral and XYZ Color Functions
Label plots with spectra. Convert wavelengths to RGB. Functions for color matching and illuminants.
This is the beginning of a set of functions for working with color as wavelengths (spectral color) and in the xyY and XYZ color spaces.Current functionality includes:spectrumLabel - Add a color bar
- 19.1K (All time)
- 9 (Last 30 days)
- 4.1 / 5
- Community
-
8 Nov 2010