
- 14.2K (All time)
- 5 (Last 30 days)
- 4.3 / 5
- Community
-
7 Aug 2002

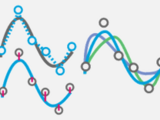
Draw lines and contours with hatches on one side of the line.
These routines allow easy plotting of lines or contours with hatches on one side. This line style is often used to represent a constraint, where one side of the line represents a no-go area.
- 2.5K (All time)
- 6 (Last 30 days)
- 5.0 / 5
- Community
-
22 Jun 2021

Updated code to replace colors in figures with hatching
This is an update of Brian Katz's update to Ben Hinkle's original applypatch and makepatch code for replacing colors in figures with hatches. This new version allows you to expand the width of hatch
- 5.1K (All time)
- 2 (Last 30 days)
- 5.0 / 5
- Community
-
21 Feb 2008

Replace solid colors with patterns.
Will create a bitmap copy of a figure with distinct colors replaced with hatch patterns. This is useful for b+w bitmap output. Vector output is not supported.
- 14.2K (All time)
- 4 (Last 30 days)
- 4.4 / 5
- Community
-
8 Jan 2019
Hatch fill patterns plus Color & Invert
Updated code hatch with color and inverted hatches
This is an update of Brian Katz's update to Ben Hinkle's original applypatch and makepatch code for replacing colors in figures with hatches as well as David's applypatch_plus. This new version
- 25.2K (All time)
- 11 (Last 30 days)
- 3.5 / 5
- Community
-
3 Jul 2011

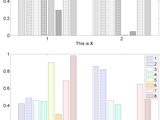
hatched bar chart (阴影/条纹填充柱状图)
function for hatched bar chart, horizontal hatched bar chart, stacked hatched bar chart. (need at least R2017b)
Basic usagey = [2 2 3 2 5; 2 5 6 2 5; 9 8 9 2 5];% Create hatched bar chart objectHB = hatchedBar(y, 'HatchType',{'/','\','.','_','x'}, 'Horizontal','off');% Draw hatched bar chartHB = HB.draw
- 503 (All time)
- 9 (Last 30 days)
- 5.0 / 5
- Community
-
14 Apr 2026
- 1.5K (All time)
- 3 (Last 30 days)
- 4.7 / 5
- Community
-
11 Apr 2023

- 9.6K (All time)
- 5 (Last 30 days)
- 4.3 / 5
- Community
-
22 Jul 2024

- 1.8K (All time)
- 1 (Last 30 days)
- 4.0 / 5
- Community
-
21 Apr 2008
Modified APPLYHATCH to allow for variable resolution output for printing.
Original APPLYHATCH allows for the conversion of a color figure to a B&W hatched figure, ideal for export for standanrd printing, as a screen resolution bitmap image. APPLYHATCH_PLUS allows for
- 3.8K (All time)
- 2 (Last 30 days)
- 3.6 / 5
- Community
-
26 Jul 2004

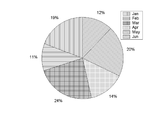
function for hatched pie chart, hatched pie chart with offset slices. (need at least R2017b)
Basic usageX = [1 3 0.5 2.5 2];% Create hatched pie chart objectHP = hatchedPie(X, 'HatchType',{'/','.','|','+','x'});% Draw hatched pie chartHP = HP.draw(); % Hatch Type
- 81 (All time)
- 1 (Last 30 days)
- -- / 5
- Community
-
14 Apr 2026

- 3.2K (All time)
- 3 (Last 30 days)
- 4.8 / 5
- Community
-
18 Mar 2013

Modification of APPLYHATCH_PLUS, allowing for color and variable thickness for hatch patterns.
This is a modification of previously submitted APPLYHATCH_PLUS. APPLYHATCH_PLUSC creates a bitmap version of the defined figure where colored elements are replaced with specified colored hatch
- 11.6K (All time)
- 8 (Last 30 days)
- 4.2 / 5
- Community
-
26 Nov 2020
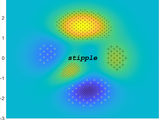
Easily apply stippling (or hatchfill) to a plot.
A simple function to plot dots or other markers as stippling (also known as hatch filling) to a plot, given a mask and corresponding coordinates. This is a common way to indicate regions of
- 894 (All time)
- 3 (Last 30 days)
- 5.0 / 5
- Community
-
22 Aug 2018

- 178 (All time)
- 3 (Last 30 days)
- -- / 5
- Community
-
4 Jul 2024

- 2.6K (All time)
- 1 (Last 30 days)
- -- / 5
- Community
-
30 May 2013

Human Circulatory System with Electric Components
This is a Simulink project to provide the values of pressure and flow in the human circulatory system with electric circuits components.
- 596 (All time)
- 1 (Last 30 days)
- 5.0 / 5
- Community
-
3 Jun 2022
Climate Data Toolbox for MATLAB
A set of low-level functions and tutorials for analyzing and displaying Earth science data.
- 19.6K (All time)
- 85 (Last 30 days)
- 5.0 / 5
- Community
-
4 May 2026

Osprey: sound visualization, measurement, localization
View and measure spectrograms of sound files, and localize sounds in them
- 26 (All time)
- 3 (Last 30 days)
- -- / 5
- Community
-
20 May 2024

- 692 (All time)
- 1 (Last 30 days)
- 4.3 / 5
- Community
-
25 Jul 2015
Fills an area with hatching or speckling (Updating original hatchfill by Neil Tandon)
of hatching patterns: - 'single' single lines - 'cross' double-crossed hatch - 'speckle' speckling inside the patch boundary (partial support) - 'outspeckle' speckling outside the
- 14.5K (All time)
- 171 (Last 30 days)
- 4.7 / 5
- Community
-
11 Jan 2018
Fills an area with hatching or speckling.
. Instead of a solid fill, one often wants to fill a patch with a hatch or speckle pattern instead. MATLAB has no built-in way to do this.The hatchfill function fills patch objects with hatching or speckling
- 18.2K (All time)
- 24 (Last 30 days)
- 4.7 / 5
- Community
-
19 Dec 2012
Extracts comments from m-files to create Contents.m and TeX-file.
ternplot.m .. brushlinktool pp.m teximage.m Contents.m dirplot_demo.m ref.tex Contents.m~ espTk2 ref.tex~ Dirplot.m hatch
- 1.7K (All time)
- 3 (Last 30 days)
- 4.0 / 5
- Community
-
27 May 2004

Tool for reading and plotting DXF files
object (optional). FEATURES:- supports: LINE, POINT, ARC, CIRCLE, ELLIPSE, LWPOLYLINE- colored entities (line and hatch color)- respects ordering of objects (back to front)- supports bulges, open/closed
- 5.7K (All time)
- 28 (Last 30 days)
- 4.9 / 5
- Community
-
26 Mar 2018

3D Plotter for Infinite Potential Well
plots a user-specified wavefunction in an infinite potential well of user-specified size.
- 887 (All time)
- 2 (Last 30 days)
- 5.0 / 5
- Community
-
21 Jun 2010

Spherical Triangle Plot Script
Draws a spherical triangle on a unit sphere, given its coordinates.
angular distance (of the opposing segment) to the their complements of corresponding great circle. The 'Inverse' option will set the program to hatch the outer area instead.
- 937 (All time)
- 2 (Last 30 days)
- 4.8 / 5
- Community
-
9 May 2012

plot_feasible.m is a simple bit of code for visualizing 2D linear programming problems.
- 3.9K (All time)
- 1 (Last 30 days)
- 4.7 / 5
- Community
-
22 Jul 2009

Generates a 'path' command for L-Edit (a CAD program) which will generate a spiral.
- 964 (All time)
- 1 (Last 30 days)
- 4.5 / 5
- Community
-
8 Oct 2010

Vibration Simulation Using MATLAB and ANSYS
Companion Software
- 15.5K (All time)
- 7 (Last 30 days)
- 4.0 / 5
- Community
-
21 Nov 2002
Enhances X-ray images of paintings for easy counting of canvas threads.
painting forensics. Paint, cracks, and shadows make it difficult to easily discern the cross-hatched weaving of the canvas threads. The min & max functions could be recast as morphological operations
- 1.9K (All time)
- 5 (Last 30 days)
- 3.3 / 5
- Community
-
10 Mar 2011

Mutliple Feedback Filter Equalizer Generator
Generates a group of multiple feedback filters based on a few equalizer parameters.
- 1.3K (All time)
- 1 (Last 30 days)
- -- / 5
- Community
-
12 May 2008

A high-fidelity MATLAB Digital Twin with a fully integrated GUI for simulating rocket engine transient aerothermodynamics, erosive ablation.
modeling using modified Bartz correlations, and supercritical liquid film cooling integration (Stechman/Hatch-Papell) powered by Python's CoolProp. The tool generates instant visual diagnostics, including
- 13 (All time)
- 5 (Last 30 days)
- -- / 5
- Community
-
30 Mar 2026

crosshatch_poly fills a polygon with slanted lines at a specified angle and separation.
- 1.6K (All time)
- 1 (Last 30 days)
- 2.0 / 5
- Community
-
22 Jul 2009

TEnvR: Toolbox for Environmental Research
Codes for data from UV-VIS, fluorescence, and NMR spectroscopies, ultrahigh resolution mass spectrometry, and for statistical analysis.
Foundation) remains in the license notice section of the codes and the toolbox is cited accordingly in any produced work as following:Goranov, A. I., Sleighter, R. L., Yordanov, D. A., and Hatcher, P. G. (2023
- 55 (All time)
- 2 (Last 30 days)
- -- / 5
- Community
-
15 Feb 2024

The gMapIoAcad library functions allow to generate an AutoCAD script directly from MatLab (MatLab, GNU Octave).
a script);gMapIoAcadCircle -- Draw a Circle;gMapIoAcadText -- Print a Text;gMapIoAcadPline -- Draw a Polyline;gMapIoAcadPolygon -- Draw a Polygon with Hatch;gMapIoAcadImage -- Insert a bitmap Image
- 4 (All time)
- 1 (Last 30 days)
- -- / 5
- Community
-
1 Dec 2024