
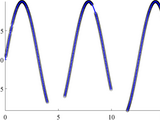
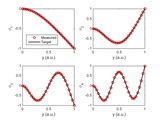
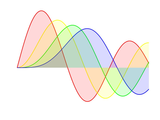
Learn Fourier analysis using live scripts and apps.
- 10.3K (All time)
- 29 (Last 30 days)
- 4.9 / 5
- Community
-
8 Oct 2025
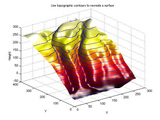
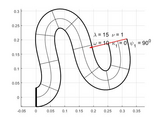
Model 2-d surfaces from scattered data
- 86.1K (All time)
- 21 (Last 30 days)
- 4.9 / 5
- Community
-
4 Mar 2016
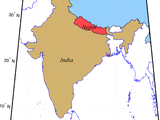
Simply plot national and US state boundaries, with or without Matlab's Mapping Toolbox.
- 11.7K (All time)
- 27 (Last 30 days)
- 4.9 / 5
- Community
-
20 Feb 2020
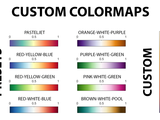
This function is able to define a customized colormap given the positions and the colors that are required to make the gradients.
- 8.4K (All time)
- 28 (Last 30 days)
- 5.0 / 5
- Community
-
11 Sep 2019
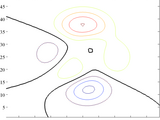
C2xyz contour matrix to coordinates
Convert values given by a contour matrix to easy-to-use cells.
- 3.8K (All time)
- 4 (Last 30 days)
- 4.8 / 5
- Community
-
20 May 2019
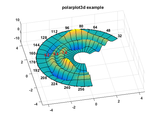
Plots 3d polar data with polar axis and polar grid
- 25.7K (All time)
- 9 (Last 30 days)
- 4.9 / 5
- Community
-
4 Mar 2016

HDL Coder Self-Guided Tutorial
Learn how to deploy an algorithm to an FPGA using MATLAB and Simulink.
- 8.4K (All time)
- 32 (Last 30 days)
- 4.9 / 5
- Community
-
9 Feb 2026
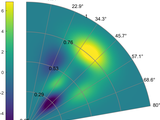
polarPcolor draws a pseudocolor plot in polar coordinates with a polar grid.
- 7.7K (All time)
- 14 (Last 30 days)
- 4.9 / 5
- Community
-
16 Jul 2024
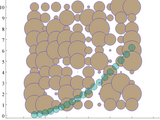
Simply plot filled circles or circle outlines.
- 4.9K (All time)
- 1 (Last 30 days)
- 4.8 / 5
- Community
-
20 May 2019
Mobile Robotics Simulation Toolbox
MATLAB and Simulink utilities for vehicle kinematics, visualization, and sensor simulation.
- 29.1K (All time)
- 66 (Last 30 days)
- 4.9 / 5
- Community
-
9 Jun 2022
A toolbox for analysis and display of Antarctica-related data
- 6.3K (All time)
- 9 (Last 30 days)
- 5.0 / 5
- Community
-
4 May 2026
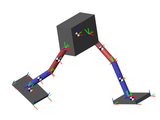
MATLAB and Simulink Robotics Arena: Walking Robot
Example files for MATLAB and Simulink Robotics Arena walking robot videos.
- 14.5K (All time)
- 53 (Last 30 days)
- 4.9 / 5
- Community
-
13 Feb 2026
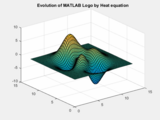
Simple Heat Equation solver using finite difference method
- 3.8K (All time)
- 2 (Last 30 days)
- 5.0 / 5
- Community
-
18 Mar 2023

GenerateJavaScriptUsingMATLABCoder
Create JavaScript and WebAssembly apps and libraries from MATLAB projects using MATLAB Coder.
- 2.4K (All time)
- 4 (Last 30 days)
- 4.8 / 5
- Community
-
6 Dec 2021
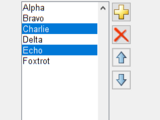
Widgets Toolbox - Compatibility Support
Compatibility Support for Widgets Toolbox content built before to R2020b
- 6.4K (All time)
- 34 (Last 30 days)
- 4.9 / 5
- Community
-
23 Mar 2023
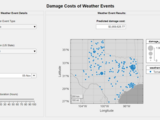
Data Science: Predict Damage Costs of Weather Events
Explore data and use machine learning to predict the damage costs of storm events based on location, time of year, and type of event
- 3.1K (All time)
- 6 (Last 30 days)
- 5.0 / 5
- Community
-
21 May 2021
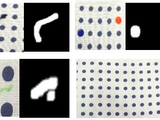
Anomaly detection and localization using deep learning(CAE)
You can learn how to detect and localize anomalies on image using Convolutional Auto Encoder.
- 1.3K (All time)
- 2 (Last 30 days)
- 5.0 / 5
- Community
-
25 Dec 2020
Interpolate over small gaps in x, but not over large gaps in x.
- 1.8K (All time)
- 3 (Last 30 days)
- 5.0 / 5
- Community
-
20 May 2019
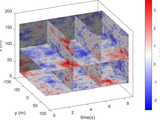
Wind field simulation (the fast version)
A three-variate spatially correlated turbulent wind field is simulated in three dimensions.
- 1.6K (All time)
- 4 (Last 30 days)
- 5.0 / 5
- Community
-
29 Jan 2023

Arduino_Engineering_Kit_Hardware_Support_18a
MATLAB and Simulink support for hardware components used in the Arduino Engineering Kit.
- 7K (All time)
- 15 (Last 30 days)
- 5.0 / 5
- Community
-
17 Sep 2019
Mode shapes extraction by time domain decomposition (TDD)
The modal parameters of a line-like structure are estimated in the time domain using displacement records only.
- 2.9K (All time)
- 2 (Last 30 days)
- 5.0 / 5
- Community
-
15 Jul 2021
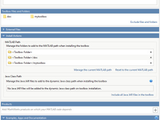
A toolbox for developing custom toolboxes in MATLAB.
- 906 (All time)
- 4 (Last 30 days)
- 4.8 / 5
- Community
-
5 Jun 2020
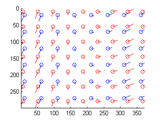
Estimates the parameters of an affine (first-order) optic flow model from two images.
- 6.9K (All time)
- 2 (Last 30 days)
- 4.8 / 5
- Community
-
4 Mar 2016
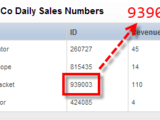
Scrape one or more numbers off of a web page
- 4.1K (All time)
- 2 (Last 30 days)
- 5.0 / 5
- Community
-
20 Mar 2018
Data Conversion Between MATLAB and .Net in Visual Studio
This example is explaining how to import or export different data types for MATLAB function in Visual Studio
- 207 (All time)
- 2 (Last 30 days)
- 5.0 / 5
- Community
-
19 Nov 2018

MATLAB suite of functions for topographic analysis
- 9.5K (All time)
- 45 (Last 30 days)
- 5.0 / 5
- Community
-
22 Sep 2025
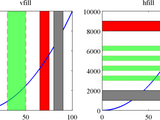
Linear plot, with extra functionality for area filling.
- 6.6K (All time)
- 3 (Last 30 days)
- 4.8 / 5
- Community
-
21 Dec 2018
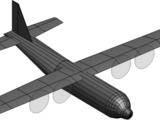
Draw a very simple 3D airplane and animate it too
- 4.1K (All time)
- 2 (Last 30 days)
- 4.8 / 5
- Community
-
4 Mar 2016
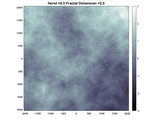
Create, Measure, Characterize, Visualize 1D, 2D, 3D Fractals
Creation of fractal curves, surfaces, & volumetric density as well as techniques to measure 1D, 2D, and 3D fractal dimension and fractalness
- 723 (All time)
- 5 (Last 30 days)
- 5.0 / 5
- Community
-
22 Mar 2021
Convert colors between rgb and hex values
- 9.8K (All time)
- 5 (Last 30 days)
- 5.0 / 5
- Community
-
20 May 2019
Create a title for a figure with multiple subplots.
- 8K (All time)
- 3 (Last 30 days)
- 4.5 / 5
- Community
-
20 May 2019
On-line support vector regression (using Gaussian kernel)
- 3.4K (All time)
- 3 (Last 30 days)
- 5.0 / 5
- Community
-
22 May 2017
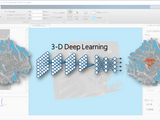
3-D Deep Learning : Lung Tumor Segmentation
How to create and train a V-Net neural network and perform semantic segmentation of lung tumors from 3-D medical images
- 1.6K (All time)
- 7 (Last 30 days)
- 5.0 / 5
- Community
-
26 Nov 2019

Predictive Maintenance in a Hydraulic Pump
Predictive maintenance algorithm developed using digital twin of hydraulic pump modeled in Simscape
- 2.9K (All time)
- 13 (Last 30 days)
- 5.0 / 5
- Community
-
18 May 2026

Return cell array of tables from HTML page.
- 1.3K (All time)
- 1 (Last 30 days)
- 5.0 / 5
- Community
-
26 Oct 2016
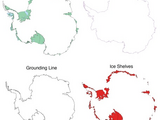
Antarctic boundaries, grounding line, and masks from InSAR
A complete MEaSUREs grounding line, coast line, and mask dataset from Mouginot et al.
- 1.2K (All time)
- 5 (Last 30 days)
- 5.0 / 5
- Community
-
7 Nov 2021
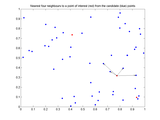
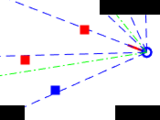
Computes nearest neighbour(s) by Euclidean distance
- 13.1K (All time)
- 5 (Last 30 days)
- 5.0 / 5
- Community
-
4 Mar 2016
A Hough transform function for detecting circles, optimised to allow search over radii.
- 22.7K (All time)
- 4 (Last 30 days)
- 4.6 / 5
- Community
-
4 Mar 2016
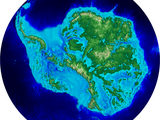
Get Bedmap2 data into Matlab. Several tools for data access, interpolation, and plotting.
- 3.5K (All time)
- 7 (Last 30 days)
- 5.0 / 5
- Community
-
23 Nov 2019
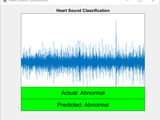
Heart Sound Classification demo as explained in the Machine Learning eBook, but now expanded to demonstrate Wavelet scattering
- 12.3K (All time)
- 5 (Last 30 days)
- 4.7 / 5
- Community
-
16 Oct 2019
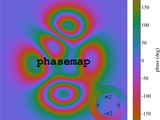
A constant-lightness cyclic colormap for phase.
- 2.2K (All time)
- 5 (Last 30 days)
- 4.9 / 5
- Community
-
20 May 2019
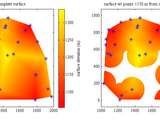
Replace or delete values in a surface farther than a given distance from points.
- 436 (All time)
- 1 (Last 30 days)
- 5.0 / 5
- Community
-
20 May 2019

Creates a gridded lookup table from scattered data in n dimensions. Documentation is packaged and integrated into MATLAB
- 1.4K (All time)
- 6 (Last 30 days)
- 5.0 / 5
- Community
-
18 Apr 2026
Simply create horizontal or vertical shaded sections of a plot.
- 1.3K (All time)
- 2 (Last 30 days)
- 5.0 / 5
- Community
-
20 May 2019

draw19 is a collection of the MATLAB's functions that allows one to draw various geometric entities in the plane.
- 753 (All time)
- 4 (Last 30 days)
- 5.0 / 5
- Community
-
29 Oct 2025
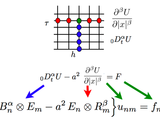
Matrix approach to discretization of ODEs and PDEs of arbitrary real order
Functions illustrating matrix approach to discretization of ODEs / PDEs with fractional derivatives.
- 7.6K (All time)
- 1 (Last 30 days)
- 5.0 / 5
- Community
-
4 Mar 2016
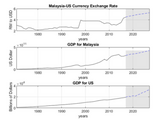
VAR Model To Predict Malaysia/U.S. Foreign Exchange Rate
Models VAR using GDP for Malaysia, GDP for U.S. and Malaysia/U.S. Foreign Exchange Rate
- 439 (All time)
- 3 (Last 30 days)
- 5.0 / 5
- Community
-
6 Jun 2019

FRED® REST API support for MATLAB
- 365 (All time)
- 4 (Last 30 days)
- 5.0 / 5
- Community
-
26 Aug 2025
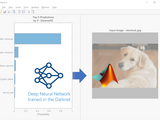
Deep Learning : Darknet Importer
Import Deep Neural Networks Trained in the Darknet Framework
- 1.8K (All time)
- 2 (Last 30 days)
- 5.0 / 5
- Community
-
3 Jul 2019
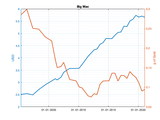
Yahoo Finance and Quandl data downloader
YahooFinance/Quandl data downloader
- 7.8K (All time)
- 10 (Last 30 days)
- 4.9 / 5
- Community
-
15 Sep 2021
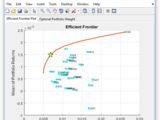
Getting Started with Portfolio Optimization (Files for Video Demo)
Files for demonstrating how to perform portfolio optimization
- 3K (All time)
- 4 (Last 30 days)
- 5.0 / 5
- Community
-
12 Sep 2017
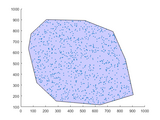
Random point inside a polygone
Create random point inside a polygone
- 122 (All time)
- 2 (Last 30 days)
- 5.0 / 5
- Community
-
15 May 2019

MATLAB Plot Gallery - Plot in Plot
Create a plot in plot
- 4K (All time)
- 1 (Last 30 days)
- 5.0 / 5
- Community
-
19 Dec 2018
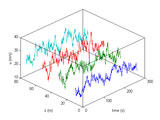
Wind field simulation (text-based input)
Simulation of spatially correlated wind velocity time-histories
- 3.7K (All time)
- 1 (Last 30 days)
- 5.0 / 5
- Community
-
27 Mar 2022
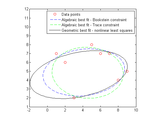
Fit ellipses to 2D points using linear or nonlinear least squares
- 14.5K (All time)
- 10 (Last 30 days)
- 4.6 / 5
- Community
-
4 Mar 2016
elfun18 is a set of functions that enable computation of various elliptic integrals and functions.
- 758 (All time)
- 5 (Last 30 days)
- 5.0 / 5
- Community
-
22 Oct 2020
Bifurcation diagrams for continuous-time dynamical systems based on analysis of local maxima and minima
- 2.2K (All time)
- 3 (Last 30 days)
- 5.0 / 5
- Community
-
4 Jul 2019
The Computation of Pi by Archimedes
Archimedes wrote 3 1/7 > pi > 3 10/71. This is how he did it.
- 3.3K (All time)
- 2 (Last 30 days)
- 5.0 / 5
- Community
-
4 Mar 2016

Deep Learning for Defect Detection on Raspberry Pi
How to create, train simple network, integrate it into pre/post image processing and generate C code to run it on Raspberry Pi
- 1.4K (All time)
- 3 (Last 30 days)
- 5.0 / 5
- Community
-
2 Sep 2023

Sensor Fusion For Orientation Estimation
Example files for performing sensor fusion on sensor data sampled from a mobile device.
- 1.7K (All time)
- 2 (Last 30 days)
- 4.8 / 5
- Community
-
26 Nov 2018