GIBBON: The Geometry and Image-Based Bioengineering add-ON for MATLAB

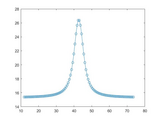
The function file fadf.m computes the Voigt/complex error function with high accuracy

Rapid and accurate computation of the Voigt function
This function file is a subroutine for rapid and accurate computation of the Voigt function. It covers the domain of practical interest 0 < x < 40,000 and 10^-4 < y < 10^2 required for

This program file is presented for highly accurate approximation of the Voigt/complex error function with small imaginary argument y ≤ 0.1.

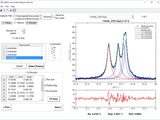
Peak fitting to Voigt or LogNormal line shapes.
Uses Matlab's lsqcurvefit to fit x and y data from a .txt file or from the workspace to resolve different line shapes (currently Voigt or reversed LogNormal). There are several types of backgrounds

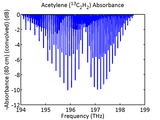
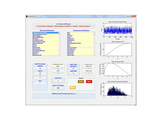
This GUI program simulates Voigt spectral lineshape and absorption from HiTRAN output file.
This GUI program simulates Voigt spectral lineshape and absorption spectrum from HiTRAN output file. The Voigt spectral lineshape is simulated from the convolution of Guassian and Lorentzian
This code approximates the Voigt function in the difficult Humlicek Regions 3 and 4.
This is an approximation of the Voigt function within the Humlicek regions 3 and 4. The approximation is one given by S.M. Abrarov et. al. "High-accurace approximation of the complex probability

Fit data to a Voigt model.
Fits data to a Voigt profile. Voigt models are commonly used to fit XPS spectra.[estimates, model] = voigtfit(x, y, initGuess, peakBounds) fits the x and y data to one or more Voigt profile models


The code returns the highly accurate full width at half maximum (FWHM) of the Voigt profile.
code1: "fullwidthVoigt.m" returns the highly accurate full width at half maximum (FWHM) of the Voigt profile for given the widths of the Lorentzian and Gaussian profile.code2
I post here a low-level Levenberg–Marquardt algorithm to fit the Voigt function with the area.
The Voigt function is given by the convolution of Lorentz function and Gauss function. I've never used this specific function until I had collaboration with scientists using Raman spectroscopy. In

I post Powell's dog leg algorithm to fit the Voigt function.
Here, I present Powell's dog leg method that is applied to the fitting of Voigt function with area. The Voigt function is given by convolution of Lorentz function and Gauss function. It is useful

A function file to compute the complex error function with high-accuracy.

codes that fits dielectric constants to CDHO, Voigt, Fourier series,and Triangular bases function
This is a collection of codes that fits dielectric constants to Classical Damped Harmonic Oscillator (CDHO) , Voigt, Fourier series,and Triangular bases functions. For details, see: Spectral curve
Program-shell that accelerates computation of the Voigt and complex error functions for the HITRAN applications.
This function file computes the Voigt and complex error functions (also known as the Faddeeva function) in a rapid algorithm by vectorized interpolation. The program is particularly efficient for

A program which fits multiple Voigt peaks to data
Tracey Peaker is a code which traces out multiple Voigt peaks in a spectrum using the lsqcurvefit function. The fit is weighted by the errors on the data points in the spectrum. The code accurately

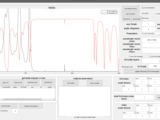
The program deconvolutes IR spectra of mordenites
intensities (a.u.)Contents:- deconvolute3VtGUI.m - main GUI program for the deconvolution- the function that perform the deconvolution- voigtNormGLform.m - creates Voigt profile function corresponding with

C++ MEX plugins to compute error functions (erf, erfc, erfi, erfcx, Faddeeva, ...) of complex args
function** Faddeeva_Dawson(z) = 0.5 sqrt(pi) exp(-z^2) erfi(z) -- Dawson functionFrom e.g. the Faddeeva function, one can also obtain the Voigt functions and other related functions.Assuming you have a C++

Simulink Block / S-Function for Windows XInput API (Xbox Controller)


Fully vectorized method to plot voxels in an indexed 3d data array
Imports HITRAN molecular absorption data as raw and absorbance data.
Loads 2004+ HITRAN format files, and applies a Voigt lineshape to each line within the desired range. Returns data in a structure containing the raw data as well as the absorption coefficient
Faddeeva function, aka plasma dispersion function

Database for an accurate algorithm for calibration-free wavelength modulation spectroscopy based on even-order harmonics
It can handle denoising of data with noise and calculus (integer or fractional order differentiation and integration).
spectrum peaks - Lorenz, Voigt, or Gaussian are unified in the frequency domain, for actual spectra which are single peaks or composed of multiple peaks, the envelope can be approximated with an exponential
Peak fitting GUI for Diffraction Data
points and/or X-values, however, check fitting range before attempting Fit up to 20 peaks in the current profile region Choose from 5 peak-shape functions: Gaussian, Lorentzian, Pseudo-Voigt, and Pearson

Solvers for large-scale, sparse, symmetric linear and quadratic matrix equations
Mathematics, Birkhäuser, Cham, 2021,pp. 369–392.https://doi.org/10.1007/978-3-030-72983-7_18.J. Saak, M. Voigt, Model reduction of constrained mechanical systems inM-M.E.S.S., IFAC-PapersOnLine 9th Vienna
generates random variates from over 870 univariate distributions

Keyboard operated peak fitting function for time-series signals.

Sandia Matlab AnalysiS Hierarchy
Transfer matrix implementation for planar structure reflectivity, includes various data fitting abilities

Visualisation of anisotropy in rock forming minerals, including elasticity, acoustic velocities (phase & group) and optical birefringence

A Matlab GUI to plot and to analyze (nano)indentation data (obtained with conical indenters)

Stochastic System Identification Toolkit (SSIT) to model, analyze and design single-cell experiments
, 2021. https://www.nature.com/articles/s41598-021-92846-0C Lou, B Stanton, YJ Chen, B Munsky, CA Voigt, Ribozyme-based insulator parts buffer synthetic circuits from genetic context, Nature biotechnology
Linear viscoelastic relaxation modulus optimization
Scripts, functions, and mat files to locate, measure, and fit the peaks and valleys in noisy time-series data sets.
You can also select a web site from the following list
Americas
- América Latina (Español)
- Canada (English)
- United States (English)
Europe
- Belgium (English)
- Denmark (English)
- Deutschland (Deutsch)
- España (Español)
- Finland (English)
- France (Français)
- Ireland (English)
- Italia (Italiano)
- Luxembourg (English)
- Netherlands (English)
- Norway (English)
- Österreich (Deutsch)
- Portugal (English)
- Sweden (English)
- Switzerland
- United Kingdom (English)
Asia Pacific
- Australia (English)
- India (English)
- New Zealand (English)
- 中国
- 日本Japanese (日本語)
- 한국Korean (한국어)