annotation
Create annotations
Syntax
Description
annotation( creates
the annotation in the default position between the points lineType)(0.3,0.3) and (0.4,0.4).
annotation( creates
a rectangle, ellipse, or text box annotation with a particular size
and location in the current figure. Specify shapeType,dim)shapeType as 'rectangle', 'ellipse',
or 'textbox'. Specify dim as
a four-element vector of the form [x y w h]. The x and y elements
determine the position and the w and h elements
determine the size.
annotation( creates
the annotation in the default position so that the lower left corner
is at shapeType)(0.3,0.3) and the width and height are both 0.1.
annotation(___, creates
the annotation and specifies properties as name-value pair arguments.
Different types of annotations support different properties. You can
specify properties with any of the input argument combinations in
the previous syntaxes.Name,Value)
annotation( creates
the annotation in the figure, uipanel, or uitab specified by container,___)container,
instead of in the current figure.
Examples
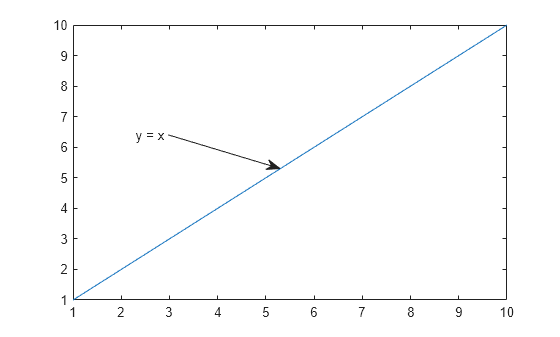
Create a simple line plot and add a text arrow to the figure. Specify the text arrow location in normalized figure coordinates, starting at the point (0.3,0.6) and ending at (0.5,0.5). Specify the text description by setting the String property.
figure
plot(1:10)
x = [0.3 0.5];
y = [0.6 0.5];
annotation('textarrow',x,y,'String','y = x ')
Create a simple line plot and add a text box annotation to the figure. Specify the text description by setting the String property. Force the box to fit tightly around the text by setting the FitBoxToText property to 'on'.
figure
plot(1:10)
dim = [.2 .5 .3 .3];
str = 'Straight Line Plot from 1 to 10';
annotation('textbox',dim,'String',str,'FitBoxToText','on');

Create a text box annotation without setting the FitBoxToText property. The text box uses the specified width and height and wraps text as needed.
figure
plot(1:10)
dim = [.2 .5 .3 .3];
str = 'Straight Line Plot from 1 to 10';
annotation('textbox',dim,'String',str)

Create a text box annotation with multiline text by setting the String property to a cell array. Each element of the cell array displays on a separate line. Force the box to fit tightly around the text by setting the FitBoxToText property to 'on'.
figure
plot(1:10)
dim = [0.2 0.5 0.3 0.3];
str = {'Straight Line Plot','from 1 to 10'};
annotation('textbox',dim,'String',str,'FitBoxToText','on');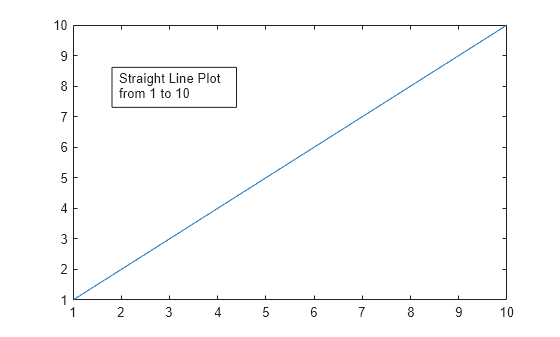
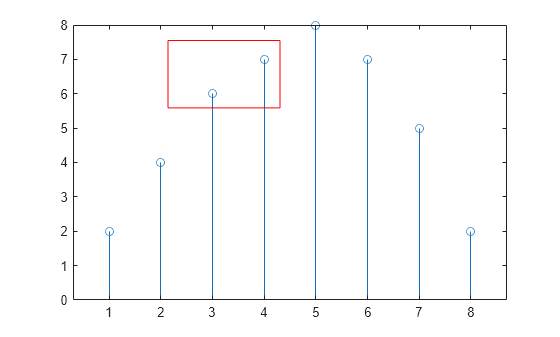
Create a stem plot and add a rectangle annotation to the figure. Change the color of the rectangle outline by specifying the Color property.
figure
data = [2 4 6 7 8 7 5 2];
stem(data)
dim = [.3 .68 .2 .2];
annotation('rectangle',dim,'Color','red')
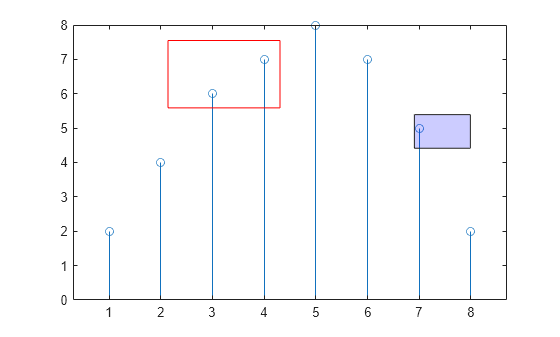
Add a second rectangle annotation to the figure. Specify the fill color by setting the FaceColor property. Add transparency by setting the FaceAlpha property to a value between 0 (completely transparent) and 1 (completely opaque).
dim2 = [.74 .56 .1 .1];
annotation('rectangle',dim2,'FaceColor','blue','FaceAlpha',.2)
Create a simple line plot and add an ellipse annotation to the figure. Specify dim as the size and location of the smallest rectangle that encloses the ellipse.
figure
x = linspace(-4,4);
y = x.^3 - 12*x;
plot(x,y)

dim = [.2 .74 .25 .15];
annotation('ellipse',dim)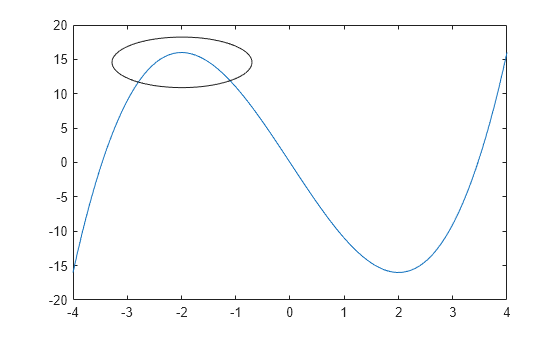
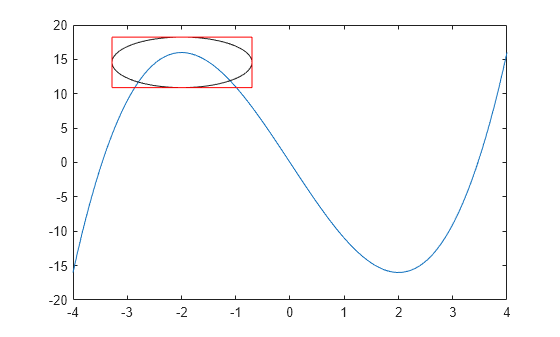
Draw a red rectangle using the same dimensions to show how the ellipse fills the rectangular area.
annotation('rectangle',dim,'Color','red')
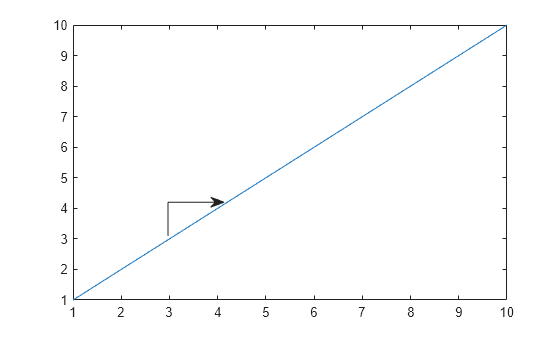
Create a simple line plot. Then, add a bent arrow to the graph by combining a line and an arrow annotation.
figure
plot(1:10)

xl = [.3 .3];
yl = [.3 .4];
annotation('line',xl,yl)

xa = [.3 .4];
ya = [.4 .4];
annotation('arrow',xa,ya)
Add a text arrow to a figure and return the annotation text arrow object, a.
figure
plot(1:10)
x = [0.3,0.5];
y = [0.6,0.5];
a = annotation('textarrow',x,y,'String','y = x ');

Modify properties of the annotation text arrow using a. For example, change the color to red and the font size to 14 points.
a.Color = 'red';
a.FontSize = 14;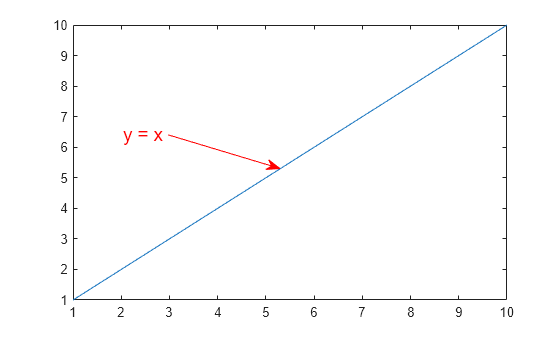
See the annotation property pages for a list of properties for each type of annotation.
Input Arguments
Name-Value Arguments
Output Arguments
More About
Version History
Introduced before R2006a