rgbplot
Plot colormap
Syntax
Description
Examples
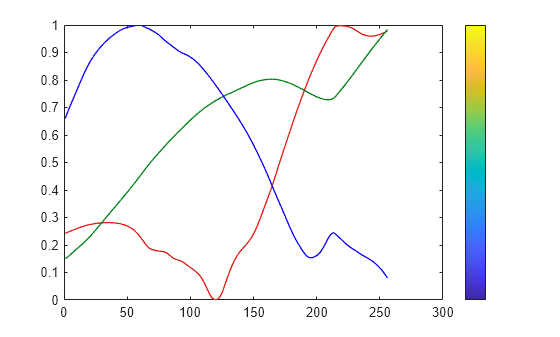
Plot the parula colormap, and display a colorbar as a visual reference.
rgbplot(parula)
hold on
colormap(parula)
colorbar('Ticks',[])
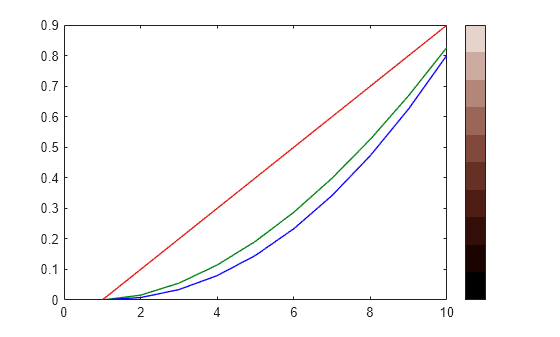
Create a custom colormap and plot it. Then display a colorbar as a visual reference.
r = (0:.1:.9)';
g = r.^1.8;
b = r.^2.1;
mymap = [r g b];
rgbplot(mymap)
hold on
colormap(mymap)
colorbar('Ticks',[])
Input Arguments
Version History
Introduced before R2006a