Create App with Linear Analysis Response Plots
Using App Designer, you can create apps that include linear analysis response plots. You can then update the plots based on user interactions within the app.
To create an app with linear analysis response plots:
Create new app and add containers for response plots.
Add components for user interaction.
Define app properties, including response plot chart objects.
Initialize properties and app configuration in startup callback function, which includes creating the plot and configuring its parent UI container.
Define callback functions for interactive components, which include code for updating chart object properties.
For more information on creating apps using App Designer, see:
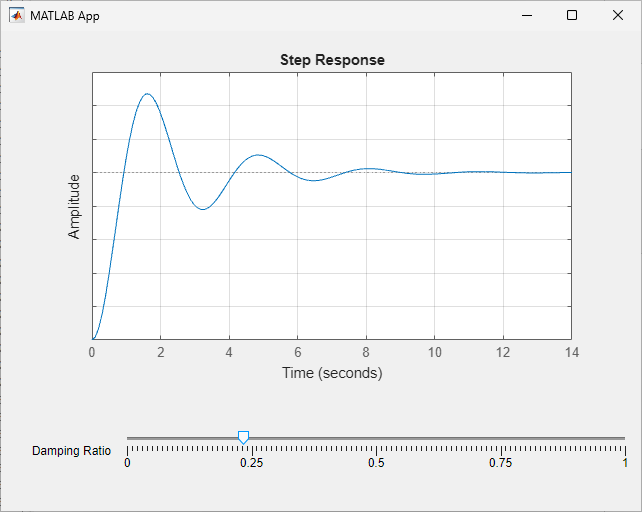
Damping Ratio App
This example creates an app that plots the normalized step response of a second-order system. The app includes a slider for adjusting the damping ratio of the system. The step response plot automatically updates when the user changes the damping ratio.

Create App and Add Container
To open App Designer, on the Apps tab, click Design App.
Create a new blank app. On the App Designer Start Page, click Blank App. App Designer opens and displays a blank app canvas.
App Designer has two views for creating an app: Design View and Code View. Use Design View to create UI components and interactively lay out your app. Use Code View to program your app behavior. You can switch between the two views using the toggle buttons in the upper right-corner of App Designer. By default, App Designer opens in Design View.
Within an app, linear analysis plots require one of the following parent components:
Grid Layout
Panel
Tab
For this example, use a grid layout manager. Drag a grid layout from the Component Library onto the canvas. A grid layout manager spans the entire app window or container that you place it in. It is invisible unless you are actively configuring it on the App Designer canvas.
To configure the grid layout manager, bring the grid layout into focus by clicking in
the area where you added it. Then, right-click the grid layout and select
Configure Grid Layout. You can then add or remove columns and
configure the resizing behavior of each row and column. For more information on configuring
a grid layout manager, see Manage App Component Position and Sizing with Grid Layout and GridLayout
Properties.
For this example, create a grid layout with two rows and two columns. The first row will contain the step response plot, which will span both columns. The second row will contain the slider, with the slider label in the first column and the slider in the second column.
Adjust the row and column widths:
Set the width of the first column to 100 pixels and configure the second column to fill the remaining space in the app.
Set the height of the second row to 100 pixels and configure the first row to fill the remaining space in the app.
Your grid layout configuration should match the following figure.

Add UI Components
To allow user interaction, add UI components to the app. For more information about available components, see App Building Components.
For this example, you add a single slider component and its associated label. To do so, drag a slider from the Component Library to the second row of the grid layout.
Next, configure the slider:
Specify the label text. Double-click the label text and, in the edit field, type
Damping Ratio.Configure the limits. Click the slider. Then, in the Component Browser, set the Limits field to
0,1Configure the tick labels. Set the MajorTicks field to
0,0.25,0.5,0.75,1.
Your app configuration should match the following figure.

Define Properties
To share data within your app, add properties. To do so, switch to Code View. Then, on the Editor tab, select Property > Private Property.
The app adds a private properties section to the app code. In this section, define
property sp to store the step plot chart object. To update the step plot,
you modify the properties of this chart object.
properties (Access = private)
    sp     % Step plot chart object
end
For more information on defining app properties, see Share Data Within App Designer Apps.
Create Startup Callback Function
To initialize the app configuration, create a startup callback function. For more information on creating callback functions, see Callbacks in App Designer.
On the Editor tab, click Callback. In the Add Callback Function dialog box:
In the Component drop-down list, select
app1.In the Callback drop-down list, select
StartUpFcn.In the Name field, keep the default value of
startupFcn.

Click Add Callback.
The app adds a new startupFcn function to the app code. In this
function, perform the following initialization steps.
Specify a natural frequency value.
wn = 2;
Specify an initial damping ratio value and configure the initial slider position to match this value.
zeta = 0.5;
app.DampingRatioSlider.Value = zeta;
Create a second-order transfer function using the natural frequency and damping ratio.
sys = tf(wn^2,[1,2*zeta*wn,wn^2]);
Create a
stepplotchart object for the transfer function, specifying the grid layout as its parent. Configure the step plot to normalize the y-axis values and display the grid.app.sp = stepplot(app.GridLayout,sys); app.sp.Normalize = "on"; app.sp.AxesStyle.GridVisible = "on";
Configure the position of the step plot such that it spans both columns in the first row of the grid layout.
app.sp.Layout.Row = 1;
app.sp.Layout.Column = [1 2];
The following code shows the final startup callback function.
function startupFcn(app)
    % Specify second-order response parameters.
    wn = 2;
    zeta = 0.5;

    % Initialize slider.
    app.DampingRatioSlider.Value = zeta;

    % Create transfer function model.
    sys = tf(wn^2,[1,2*zeta*wn,wn^2]);

    % Create step plot.
    app.sp = stepplot(app.GridLayout,sys);
    app.sp.Normalize = "on";
    app.sp.AxesStyle.GridVisible = "on";

    % Configure step response layout.
    app.sp.Layout.Row = 1;
    app.sp.Layout.Column = [1 2];
end
Create Callback Functions for UI Components
To update the step plot based on the slider value, define a callback function for when the slider value changes. On the Editor tab, click Callback. In the Add Callback Function dialog box:
In the Component drop-down list, select
DampingRatioSlider.In the Callback drop-down list, select
ValueChangedFcn.In the Name field, keep the default value of
DampingRatioSliderValueChanged.

Click Add Callback.
The app adds a new DampingRatioSliderValueChanged function to the app
code. In this function, perform the following steps to update the step plot.
Set the damping ratio to the new slider value..
zeta = app.DampingRatioSlider.Value;
Create a second-order transfer function using the new damping ratio value.
sys = tf(wn^2,[1,2*zeta*wn,wn^2]);
Update the model source data for the step plot chart object.
app.sp.Responses(1).SourceData.Model = sys;
The following code shows the final startup callback function.
function DampingRatioSliderValueChanged(app, event)
    % Specify natural frequency.
    wn = 2;

    % Obtain new damping ratio.
    zeta = app.DampingRatioSlider.Value;

    % Create transfer function model.
    sys = tf(wn^2,[1,2*zeta*wn,wn^2]);

    % Update step plot model.
    app.sp.Responses(1).SourceData.Model = sys;
end
Save and Run App
To save your app, on the Editor tab, click Save.
In the Save dialog box, select a file location, specify an app file name, and click
Save. For this example, use the name
DampingRatio.mlapp
Then, on the Editor tab, click Run.

When you adjust the slider, the plot updates based on the new damping ratio.
To run the app from the command line, type the app name.
DampingRatio