Plot the Impulse Response Function of Conditional Mean Model
This topic presents several examples that show how to plot and return the impulse response function (IRF) of univariate autoregressive moving average (ARMA) models. The examples also show how to interact with the plots.
The Econometrics Toolbox™ functions impulse and armairf use the same method to compute the IRF of a univariate
conditional mean model, by default. However, the functions have differences, as
described in this table.
| Function | Description | Required Input | Notes |
|---|---|---|---|
impulse | Plots (computes) IRF of an ARIMA model specified by an arima model object | Fully specified arima model object, such as a
model returned by estimate |
|
armairf | Plots (computes) IRF of an ARIMA model specified by overall AR and MA lag operator polynomials | Arrays containing the overall AR and MA lag operator polynomial
coefficients, or LagOp lag operator
polynomial objects representing the overall AR and MA
components |
|
IRF of Moving Average Model
This example shows how to plot and return the IRF of a pure MA model by using impulse and armairf. The example also shows how to change the color of the plotted IRFs.
The equation for an MA(q) model is
where is a q-degree MA lag operator polynomial,
The IRF for an MA model is the sequence of MA coefficients
Plot IRF Using impulse
Create a zero-mean MA(3) model with coefficients , , and and an innovation variance of 1.
ma = [0.8 0.5 -0.1];
Mdl = arima('Constant',0,'MA',ma,'Variance',1);
Mdl is a fully specified arima model object representing the MA(3) model.
Plot the IRF of the MA(3) model.
impulse(Mdl)
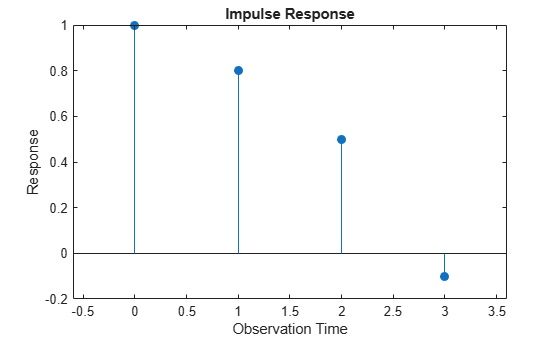
impulse returns a stem plot containing 1 at period 0, followed by the values of the MA coefficients at their lags.
For an MA model, the impulse response function stops after q periods. In this example, the last nonzero coefficient is at lag q = 3.
Return the IRF by calling impulse and specifying an output argument.
periods = (0:3)';
dm = impulse(Mdl);
IRF = table(periods,dm)
IRF=4×2 table
    periods     dm
    _______    ____

       0          1
       1        0.8
       2        0.5
       3       -0.1
To change aspects of the stem plot, you must set values of its properties. The stem plot handle is in the Children property of the plot axes handle.
Extract the stem plot handle from the current axes handle.
h = gca;
hstem = h.Children;
Change the color of the stem plot to red by using the RGB color value.
hstem.Color = [1 0 0];

Plot IRF Using armairf
Plot the IRF of the MA(3) model by passing ma as the MA coefficients (second input). Specify an empty array for the AR polynomial coefficients (first input). Return the IRF and plot handle.
[dm,h] = armairf([],ma);

table(periods,dm)
ans=4×2 table
    periods     dm
    _______    ____

       0          1
       1        0.8
       2        0.5
       3       -0.1
Unlike impulse, armairf returns a time series plot.
Change the color of the plot line to red.
h.Color = [1 0 0];

IRF of Autoregressive Model
This example shows how to plot the IRF of an AR model by using impulse and armairf. Also, the example shows how changes to the innovation variance affect the IRF.
The equation of an AR(p) model is
where is the -degree AR lag operator polynomial .
An AR process is stationary when the AR lag operator polynomial is stable, which means all its roots lie outside the unit circle. In this case, the infinite-degree inverse polynomial has absolutely summable coefficients, and the IRF decays to zero.
Plot IRF Using impulse
Create an AR(2) model with coefficients and , a model constant of 0.5, and an innovation variance of 1.
ar = [0.5 -0.75];
Mdl = arima('Constant',0.5,'AR',ar,'Variance',1);
Plot the IRF of the AR(2) model for 31 periods, from periods 0 through 30.
numObs = 31;
impulse(Mdl,numObs)

The IRF decays in a sinusoidal pattern.
Increase the constant to 100, and then plot the IRF of the adjusted AR(2) model.
Mdl.Constant = 100;
impulse(Mdl,numObs)

Because deterministic components are not present in the IRF, it is unaffected by the increased constant.
Decrease the innovation variance to 1e-5, and then plot the IRF of the adjusted AR(2) model.
Mdl.Variance = 1e-5;
impulse(Mdl,numObs)

Because impulse always applies a unit shock to the innovation of the system, the IRF is unaffected by the decreased innovation variance.
Plot IRF Using armairf
Plot the IRF of the original AR(2) model by passing ar as the AR coefficients (first input). Specify an empty array for the MA polynomial coefficients (second input). Specify 31 periods.
armairf(ar,[],'NumObs',numObs)
Plot the IRF specifying an innovation variance of 1e-5.
armairf(ar,[],'NumObs',numObs,'InnovCov',1e-5);

Because armairf applies a one-standard-deviation innovation shock to the system, the scale of the IRF is smaller in this case.
IRF of ARMA Model
This example shows how to plot the IRF of an ARMA model by using impulse and armairf.
The equation of an ARMA(p,q) model is
where:
is the p-degree AR lag operator polynomial .
is the q-degree MA lag operator polynomial .
An ARMA process is stationary when the AR lag operator polynomial is stable, which means all its roots lie outside the unit circle. In this case, the infinite-degree inverse polynomial has absolutely summable coefficients, and the IRF decays to zero.
Plot IRF Using impluse
Create an ARMA(2,1) model with coefficients , , and , a model constant of 0, and an innovation variance of 1.
ar = [0.6 -0.3];
ma = 0.4;
Mdl = arima('AR',ar,'MA',ma,'Constant',0,'Variance',1);
Plot the IRF of the ARMA(2,1) model for 11 periods, from periods 0 through 10.
numObs = 11;
impulse(Mdl,numObs)

The IRF decays in a sinusoidal pattern.
Plot IRF Using armairf
Plot the IRF of the ARMA(2,1) model by passing ar as the AR coefficients (first input) and ma as the MA coefficients (second input). Specify 11 periods.
armairf(ar,ma,'NumObs',numObs)
IRF of Seasonal AR Model
This example shows how to plot and return the IRF of a seasonal AR model by using impulse and armairf. Also, the example shows how to prepare LagOp lag operator polynomials as inputs to armairf.
The equation of an SAR model is
,
where:
is the -degree AR lag operator polynomial .
is the -degree seasonal AR lag operator polynomial .
Like a pure AR process, an SAR process is stationary when the product is stable. In this case, the infinite-degree inverse polynomial has absolutely summable coefficients, and the IRF decays to zero.
Plot IRF Using impulse
Create a quarterly SAR model with coefficients and , a model constant of 0, and an innovation variance of 1.
ar = 0.5;
sar = -0.4;
sarlags = 4;
Mdl = arima('AR',ar,'SAR',sar,'SARLags',sarlags,...
    'Constant',0,'Variance',1)
Mdl =
  arima with properties:

     Description: "ARIMA(1,0,0) Model with Seasonal AR(4) (Gaussian Distribution)"
      SeriesName: "Y"
    Distribution: Name = "Gaussian"
               P: 5
               D: 0
               Q: 0
        Constant: 0
              AR: {0.5} at lag [1]
             SAR: {-0.4} at lag [4]
              MA: {}
             SMA: {}
     Seasonality: 0
            Beta: [1×0]
        Variance: 1
Plot the IRF of the SAR model for 17 quarters, from quarters 0 through 16.
numObs = 17;
impulse(Mdl,numObs)

The IRF decays in a sinusoidal pattern.
Return the IRF.
irfIMPULSE = impulse(Mdl,numObs);
Plot IRF Using armirf
armairf accepts one overall AR polynomial. Therefore, you must multiply all AR and differencing lag operator polynomials present in the model before calling armairf.
Create lag operator polynomials for the AR and SAR polynomials. For each polynomial:
Include the lag 0 term, which has a coefficient of 1.
Negate the coefficients to express the polynomials in lag operator notation, with all AR polynomials on the left side of the equation.
ARLOP = LagOp([1 -ar],'Lags',[0 1])ARLOP =
1-D Lag Operator Polynomial:
-----------------------------
Coefficients: [1 -0.5]
Lags: [0 1]
Degree: 1
Dimension: 1
MALOP = LagOp([1 -sar],'Lags',[0 sarlags])MALOP =
1-D Lag Operator Polynomial:
-----------------------------
Coefficients: [1 0.4]
Lags: [0 4]
Degree: 4
Dimension: 1
Multiply the polynomials.
ARProdLOP = ARLOP*MALOP
ARProdLOP =
    1-D Lag Operator Polynomial:
    -----------------------------
        Coefficients: [1 -0.5 0.4 -0.2]
                Lags: [0 1 4 5]
              Degree: 5
           Dimension: 1
ARProdLOP is a LagOp object representing the product of the AR and SAR polynomials of the SAR model.
Plot and return the IRF by passing ARProdLOP as the AR polynomial (first input). Specify an empty array for the MA polynomial (second input). To plot the IRF, also return the plot handle.
[irfARMAIRF,h] = armairf(ARProdLOP,[],'NumObs',numObs);
Compare the IRFs.
periods = (0:(numObs - 1))';
table(periods,irfIMPULSE,irfARMAIRF)
ans=17×3 table
    periods    irfIMPULSE    irfARMAIRF
    _______    __________    __________

       0                1             1
       1              0.5           0.5
       2             0.25          0.25
       3            0.125         0.125
       4          -0.3375       -0.3375
       5         -0.16875      -0.16875
       6        -0.084375     -0.084375
       7        -0.042188     -0.042188
       8          0.13891       0.13891
       9         0.069453      0.069453
      10         0.034727      0.034727
      11         0.017363      0.017363
      12        -0.055318     -0.055318
      13        -0.027659     -0.027659
      14         -0.01383      -0.01383
      15       -0.0069148    -0.0069148
      ⋮
The IRFs returned by the two functions appear equivalent.
More About the Impulse Response Function
Consider the general linear model of a univariate time series yt
where:
{εt} is a sequence of uncorrelated, identically distributed random variables with standard deviation σ.
a(L) is an AR lag operator polynomial.
c is the model constant.
xtβ is the exogenous regression component. xt is a row vector of observations of the exogenous variables at time t, and β is the corresponding column vector of regression coefficients.
b(L) is an MA lag operator polynomial.
Assuming a(L) is nonzero, a succinct representation of the model is
where:
is the infinite-degree MA lag operator polynomial with scalar coefficients ψj, j = 0,1,2,… and ψ0 = 1.
mt is the deterministic, innovation-free conditional mean of the process at time t.
The impulse response function (IRF) is the dynamic response of the system to a single impulse (innovation shock). The IRF measures the change to the response j periods in the future due to a change in the innovation at time t, for j = 0,1,2,…. Symbolically, the IRF at period j is
The sequence of dynamic multipliers [1], ψ0, ψ1, ψ2,..., measures the sensitivity of the process to a purely transitory change in the innovation process, with past responses and future innovations set to 0. Because the partial derivative is taken with respect to the innovation, the presence of deterministic terms in the model, such as the constant and the exogenous regression component, has no effect on the impulse responses.
Properties of the IRF determine characteristics of the process:
If the sequence is absolutely summable, yt is a covariance-stationary stochastic process [2]. For a stationary stochastic process, the impact on the process due to a change in εt is not permanent, and the effect of the impulse decays to zero.
Otherwise, the process yt is nonstationary, and a change in εt affects the process permanently.
Because innovations can be interpreted as one-step-ahead forecast errors, the impulse response is also known as the forecast error impulse response.
References
[1] Hamilton, James D. Time Series Analysis. Princeton, NJ: Princeton University Press, 1994.
[2] Wold, Herman. "A Study in the Analysis of Stationary Time Series." Journal of the Institute of Actuaries 70 (March 1939): 113–115. https://doi.org/10.1017/S0020268100011574.