Main Content

contourcbar

Color bar for filled contour map display

    Description

    Add Color Bar

    example

    contourcbar displays a vertical color bar to the right of the current axes. Color bars display the current colormap and indicate the mapping of data values into the colormap. If the current axes contains a contour object created by the contourm, contourfm, contour3m, or geoshow function, then the contourcbar function breaks the colormap into sections that correspond to the contour levels in the plot. Otherwise, the color bar displays the current colormap.

    example

    contourcbar(location) displays the color bar in a specific location, such as "northoutside".

    contourcbar(___,Name,Value) modifies the color bar appearance using one or more name-value arguments, in addition to any combination of input arguments from the previous syntaxes. For example, "Direction","reverse" reverses the color scale.

    contourcbar(ax,___) adds a color bar to the axes specified by ax. Specify the target axes as the first argument in any of the previous syntaxes.

    example

    c = contourcbar(___) returns the ColorBar object.

    Remove Color Bar

    contourcbar("off") deletes all color bars associated with the current axes.

    contourcbar(ax,"off") deletes all color bars associated with the target axes.

    Examples

    collapse all

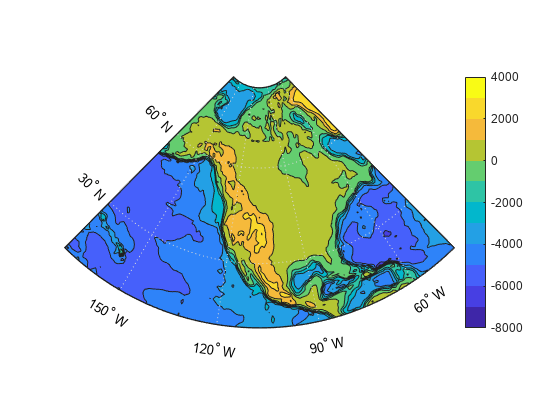
    Create a filled contour plot of elevation and bathymetry data for North America. Specify a new contour level every 1000 meters.

    load topo60c
    worldmap("north america")
    levels = -8000:1000:4000;
    contourfm(topo60c,topo60cR,levels)

    Set the colormap limits using the minimum and maximum contour levels. Then, add a color bar.

    clim([min(levels) max(levels)])
    contourcbar

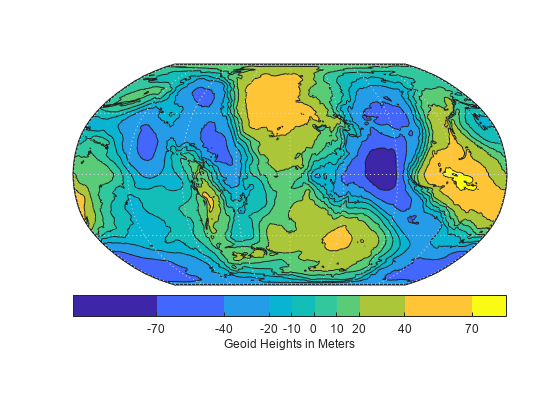
    Read spatially referenced geoid heights from the EGM96 geoid model. Display the data using a contour plot, specifying non-uniform contour levels.

    worldmap world
    plabel off
    mlabel off
    
    [N,R] = egm96geoid;
    levels = [-70 -40 -20 -10 0 10 20 40 70];
    contourfm(N,R,levels)

    Specify the colormap limits using the minimum and maximum geoid heights. Then, add a labeled colorbar below the contour plot. Change the tick mark locations so they match the contour levels.

    clim([min(min(N)) max(max(N))])
    cb = contourcbar("southoutside");
    cb.XLabel.String = "Geoid Heights in Meters";
    cb.Ticks = levels;

    Input Arguments

    collapse all

    Location of the color bar with respect to the axes, specified as one of the values in this table.

    ValueResulting LocationResulting Orientation
    "north"Top of axesHorizontal
    "south"Bottom of axesHorizontal
    "east"Right side of axesVertical
    "west"Left side of axesVertical
    "northoutside"Top outside of axesHorizontal
    "southoutside"Bottom outside of axesHorizontal
    "eastoutside"Right outside of axes (default)Vertical
    "westoutside"Left outside of axesVertical

    If a color bar already exists in the specified location, then an updated color bar replaces the existing one. To ensure that the color bar does not overlap the graph, specify a location with the suffix outside.

    You also can set the color bar location using the Location property. For example, contourcbar("Location","northoutside") is the same as contourcbar("northoutside").

    Example: contourcbar("westoutside")

    Target axes that contains the associated data visualization, specified as an Axes object. If you do not specify a target axes, then the function affects the current axes.

    Name-Value Arguments

    Specify optional pairs of arguments as Name1=Value1,...,NameN=ValueN, where Name is the argument name and Value is the corresponding value. Name-value arguments must appear after other arguments, but the order of the pairs does not matter.

    Example: contourcbar(FontSize=12,Direction="reverse") sets the font size to 12 and reverses the direction of the color scale

    Before R2021a, use commas to separate each name and value, and enclose Name in quotes.

    Example: contourcbar("FontSize",12,"Direction","reverse") sets the font size to 12 and reverses the direction of the color scale

    Note

    Use name-value arguments to specify values for the properties of the ColorBar object created by this function. The properties listed here are only a subset. For a complete list, see ColorBar Properties.

    Location with respect to the axes, specified as one of the values listed in this table.

    ValueResulting LocationResulting Orientation
    "north"Top of axesHorizontal
    "south"Bottom of axesHorizontal
    "east"Right side of axesVertical
    "west"Left side of axesVertical
    "northoutside"Top outside of axesHorizontal
    "southoutside"Bottom outside of axesHorizontal
    "eastoutside"Right outside of axes (default)Vertical
    "westoutside"Left outside of axesVertical
    "manual"Determined by Position propertyVertical

    To display the color bar in a location that does not appear in the table, use the Position property to specify a custom location. If you specify the Position property, then MATLAB® specifies the Location property as "manual". The associated axes does not resize to accommodate the color bar when the Location property is specified as "manual".

    Tick mark labels, specified as a cell array of character vectors, a string array, a numeric array, a character vector, or a categorical array. By default, the color bar labels the tick marks with numeric values. If you specify labels and do not specify enough labels for all the tick marks, then, for the remaining tick marks, MATLAB cycles through the specified labels.

    If you specify this property as a categorical array, MATLAB uses the values in the array, not the categories.

    Example: {"cold","warm","hot"}

    Tick mark locations, specified as a vector of increasing numeric values. The values do not need to be equally spaced. If you do not want tick marks displayed, then set the property to the empty vector, [].

    Example: [-1 0 1 2 3 4 5]

    Data Types: single | double

    Direction of the color scale, specified as one of these values:

    • "normal" — Display the colormap and labels ascending from bottom to top for a vertical color bar, and ascending from left to right for a horizontal color bar.

    • "reverse" — Display the colormap and labels descending from bottom to top for a vertical color bar, and descending from left to right for a horizontal color bar.

    Font size, specified as a positive scalar in point units. The default font size depends on the specific operating system and locale.

    If you change the axes font size, then MATLAB automatically sets the font size of the color bar to 90% of the axes font size. If you manually set the font size of the color bar, then changing the axes font size does not affect the color bar font.

    Tips

    • The contourcbar function supports the same syntaxes and options as the colorbar function.

    • If the axes contains multiple contour objects created by the contourm, contourfm, contour3m, or geoshow function, then the contourcbar function divides the color bar into sections using the first contour object it finds in the axes.

    • To add a text description along the color bar, access the underlying text object using the Label property of the color bar.

      c.Label.String = "My Colorbar Label";
      

      To change the label appearance, such as the font style or color, set other text properties. For a list of properties, see Text Properties. For example, this code changes the font size.

      c.Label.FontSize = 12;

    • Adding a color bar might resize the axes to accommodate the color bar.

    • If an axes does not exist, then the contourcbar function creates a blank axes and displays a color bar with the default colormap.

    Version History

    Introduced in R2011b

    expand all