Programmatic Fitting
MATLAB Functions for Polynomial Models
Two MATLAB® functions can model your data with a polynomial.
Polynomial Fit Functions
Function | Description |
|---|---|
| |
|
If you are trying to model a physical situation, it is always important to consider whether a model of a specific order is meaningful in your situation.
Linear Model with Nonpolynomial Terms
This example shows how to fit data with a linear model containing nonpolynomial terms.
When a polynomial function does not produce a satisfactory model of your data, you can try using a linear model with nonpolynomial terms. For example, consider the following function that is linear in the parameters , , and , but nonlinear in the data:
You can compute the unknown coefficients , , and by constructing and solving a set of simultaneous equations and solving for the parameters. The following syntax accomplishes this by forming a design matrix, where each column represents a variable used to predict the response (a term in the model) and each row corresponds to one observation of those variables.
Enter t and y as column vectors.
t = [0 0.3 0.8 1.1 1.6 2.3]';
y = [0.6 0.67 1.01 1.35 1.47 1.25]';
Form the design matrix.
X = [ones(size(t)) exp(-t) t.*exp(-t)];
Calculate model coefficients.
a = X\y
a = 3×1

    1.3983
   -0.8860
    0.3085
Therefore, the model of the data is given by
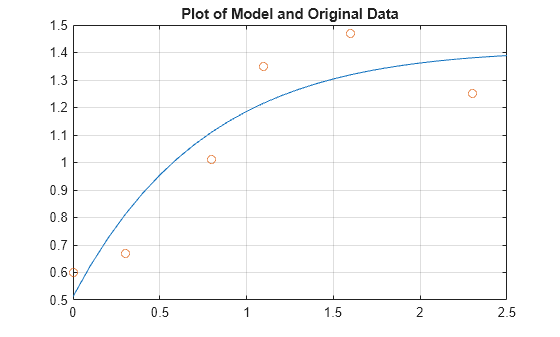
Now evaluate the model at regularly spaced points and plot the model with the original data.
T = (0:0.1:2.5)';
Y = [ones(size(T))  exp(-T)  T.*exp(-T)]*a;
plot(T,Y,'-',t,y,'o'), grid on
title('Plot of Model and Original Data')
Multiple Regression
This example shows how to use multiple regression to model data that is a function of more than one predictor variable.
When y is a function of more than one predictor variable, the matrix equations that express the relationships among the variables must be expanded to accommodate the additional data. This is called multiple regression.
Measure a quantity for several values of and . Store these values in vectors x1, x2, and y, respectively.
x1 = [.2 .5 .6 .8 1.0 1.1]';
x2 = [.1 .3 .4 .9 1.1 1.4]';
y  = [.17 .26 .28 .23 .27 .24]';
A model of this data is of the form
Multiple regression solves for unknown coefficients , , and by minimizing the sum of the squares of the deviations of the data from the model (least-squares fit).
Construct and solve the set of simultaneous equations by forming a design matrix, X.
X = [ones(size(x1)) x1 x2];
Solve for the parameters by using the backslash operator.
a = X\y
a = 3×1

    0.1018
    0.4844
   -0.2847
The least-squares fit model of the data is
To validate the model, find the maximum of the absolute value of the deviation of the data from the model.
Y = X*a;
MaxErr = max(abs(Y - y))
MaxErr =
0.0038
This value is much smaller than any of the data values, indicating that this model accurately follows the data.
Programmatic Fitting
This example shows how to use MATLAB functions to:
Load sample census data from census.mat, which contains U.S. population data from the years 1790 to 1990.
load censusThis adds the following two variables to the MATLAB workspace.
cdateis a column vector containing the years 1790 to 1990 in increments of 10.popis a column vector with the U.S. population numbers corresponding to each year incdate.
Plot the data.
plot(cdate,pop,'ro')
title('U.S. Population from 1790 to 1990')
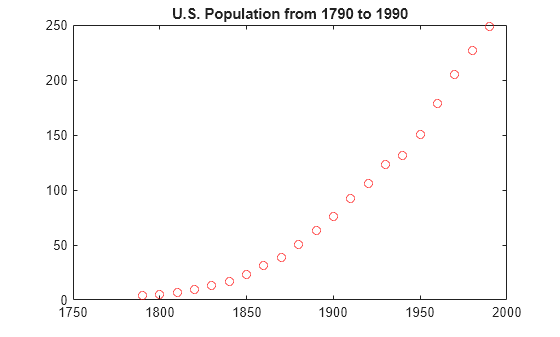
The plot shows a strong pattern, which indicates a high correlation between the variables.
Calculate Correlation Coefficients
In this portion of the example, you determine the statistical correlation
between the variables cdate and pop to
justify modeling the data. For more information about correlation coefficients,
see Linear Correlation.
Calculate the correlation-coefficient matrix.
corrcoef(cdate,pop)
ans = 2×2

    1.0000    0.9597
    0.9597    1.0000
The diagonal matrix elements represent the perfect correlation of each variable with itself and are equal to 1. The off-diagonal elements are very close to 1, indicating that there is a strong statistical correlation between the variables cdate and pop.
Fit a Polynomial to the Data
This portion of the example applies the polyfit and polyval
MATLAB functions to model the data.
Calculate fit parameters.
[p,ErrorEst] = polyfit(cdate,pop,2);
Evaluate the fit.
pop_fit = polyval(p,cdate,ErrorEst);
Plot the data and the fit.
plot(cdate,pop_fit,'-',cdate,pop,'+');
title('U.S. Population from 1790 to 1990')
legend('Polynomial Model','Data','Location','NorthWest');
xlabel('Census Year');
ylabel('Population (millions)');
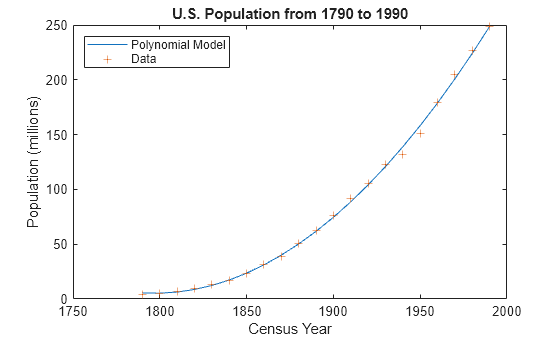
The plot shows that the quadratic-polynomial fit provides a good approximation to the data.
Calculate the residuals for this fit.
res = pop - pop_fit;
figure, plot(cdate,res,'+')
title('Residuals for the Quadratic Polynomial Model')
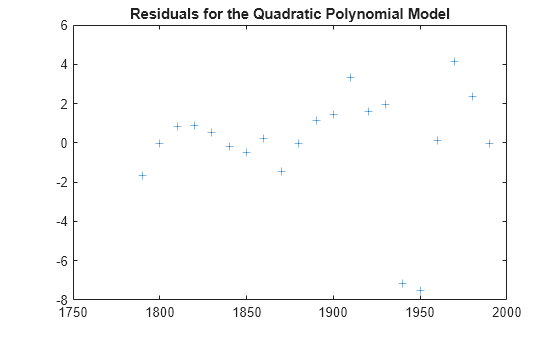
Notice that the plot of the residuals exhibits a pattern, which indicates that a second-degree polynomial might not be appropriate for modeling this data.
Plot and Calculate Confidence Bounds
Confidence bounds are confidence intervals for a predicted response. The width of the interval indicates the degree of certainty of the fit.
This portion of the example applies polyfit and polyval to the
census sample data to produce confidence bounds for a
second-order polynomial model.
The following code uses an interval of , which corresponds to a 95% confidence interval for large samples.
Evaluate the fit and the prediction error estimate (delta).
[pop_fit,delta] = polyval(p,cdate,ErrorEst);
Plot the data, the fit, and the confidence bounds.
plot(cdate,pop,'+',...
     cdate,pop_fit,'g-',...
     cdate,pop_fit+2*delta,'r:',...
     cdate,pop_fit-2*delta,'r:');
xlabel('Census Year');
ylabel('Population (millions)');
title('Quadratic Polynomial Fit with Confidence Bounds')
grid on
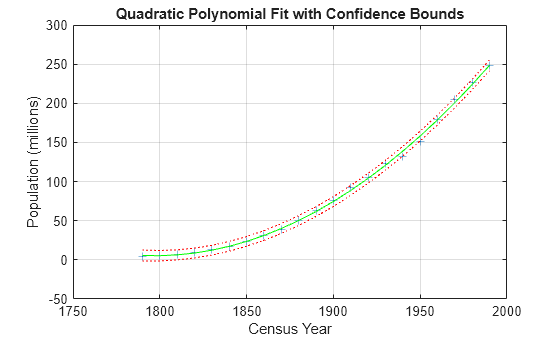
The 95% interval indicates that you have a 95% chance that a new observation will fall within the bounds.