animatedline
Create animated line
Syntax
Description
an = animatedlineaddpoints function.
an = animatedline(___,Name,Value)'Color','r' sets the line color to red. Use this
option after any of the input argument combinations in the previous
syntaxes.
Examples
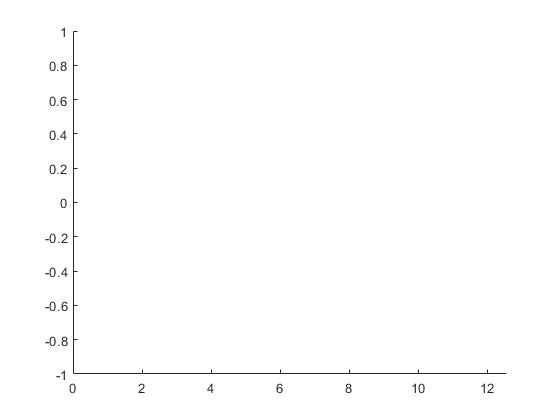
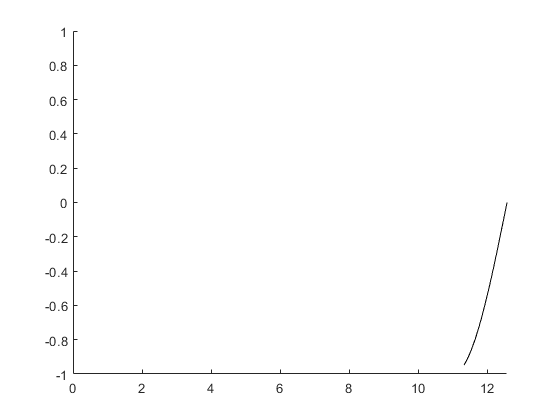
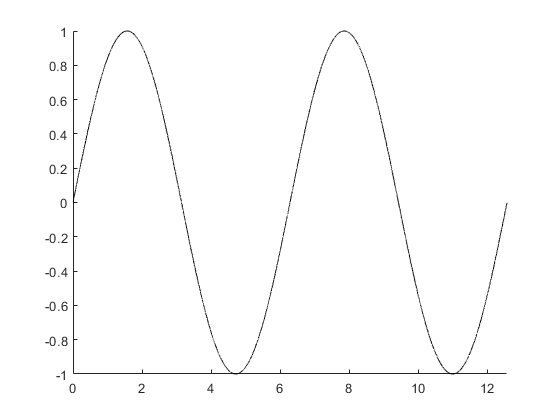
Create the initial animated line object. Then, use a loop to add 1,000 points to the line. After adding each new point, use drawnow to display the new point on the screen.
h = animatedline;
axis([0,4*pi,-1,1])

x = linspace(0,4*pi,1000);
y = sin(x);
for k = 1:length(x)
    addpoints(h,x(k),y(k));
    drawnow
end
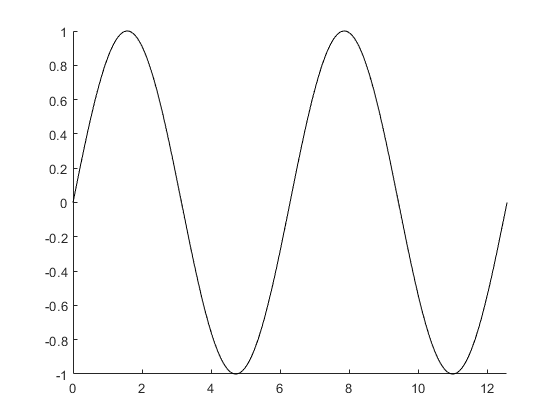
For faster rendering, add more than one point to the line each time through the loop or use drawnow limitrate.
Query the points of the line.
[xdata,ydata] = getpoints(h);
Clear the points from the line.
clearpoints(h)
drawnow
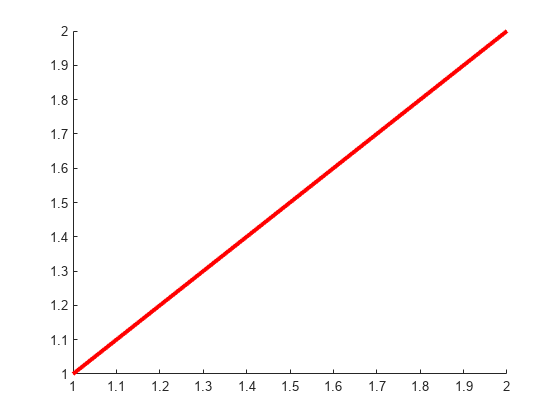
Set the color of the animated line to red and set its line width to 3 points.
x = [1 2];
y = [1 2];
h = animatedline(x,y,'Color','r','LineWidth',3);
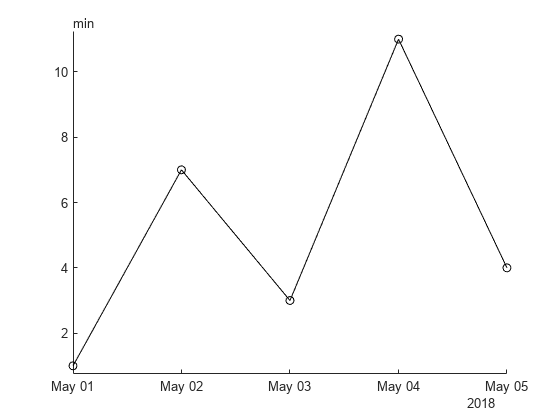
To plot nonnumeric points, such as datetime and duration values, start by initializing the animated line with values of the type you want to plot. You can specify either the first point in your plot or placeholder values such as NaT or NaN.
For example, plot datetime values on the x-axis and duration values (minutes) on the y-axis. Initialize the animated line with a NaT value and a minutes(NaN) value. Then create a datetime vector (x) and a duration vector (y) and add the points in those vectors to the animated line.
an = animatedline(NaT,minutes(NaN),"Marker","o");
x = datetime(2018,5,1:5);
y = minutes([1 7 3 11 4]);
addpoints(an,x,y)
Limit the number of points in the animated line to 100. Use a loop to add one point to the line at a time. When the line contains 100 points, adding a new point to the line deletes the oldest point.
h = animatedline('MaximumNumPoints',100);
axis([0,4*pi,-1,1])

x = linspace(0,4*pi,1000);
y = sin(x);
for k = 1:length(x)
    addpoints(h,x(k),y(k));
    drawnow
end
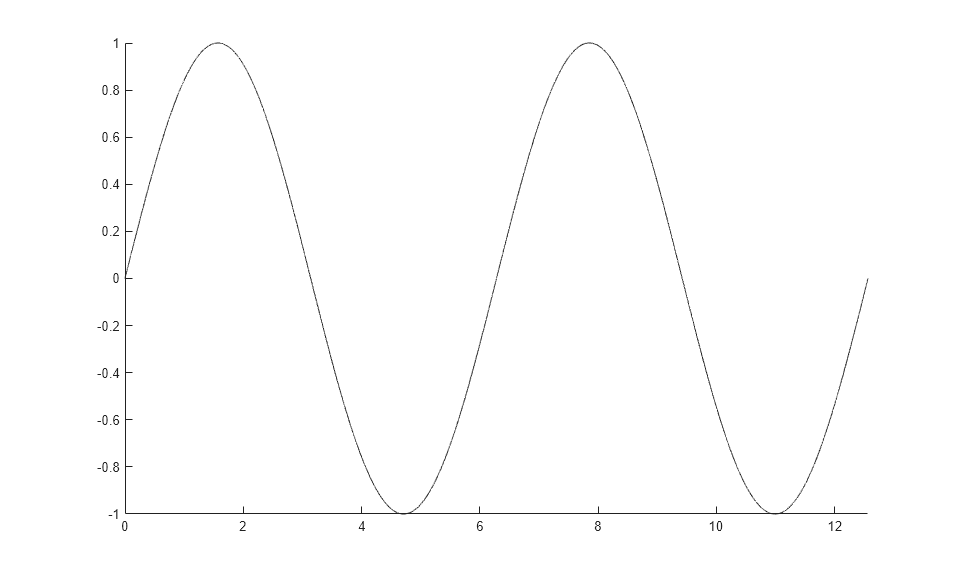
Use a loop to add 100,000 points to an animated line. Since the number of points is large, adding one point to the line each time through the loop might be slow. Instead, add 100 points to the line each time through the loop for a faster animation.
h = animatedline;
axis([0,4*pi,-1,1])

numpoints = 100000;
x = linspace(0,4*pi,numpoints);
y = sin(x);
for k = 1:100:numpoints-99
    xvec = x(k:k+99);
    yvec = y(k:k+99);
    addpoints(h,xvec,yvec)
    drawnow
end
Another technique for creating faster animations is to use drawnow limitrate instead of drawnow.
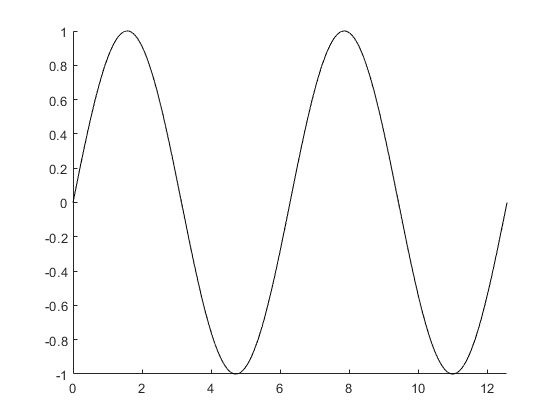
Use a loop to add 100,000 points to an animated line. Since the number of points is large, using drawnow to display the changes might be slow. Instead, use drawnow limitrate for a faster animation.
h = animatedline;
axis([0,4*pi,-1,1])
drawnow

numpoints = 100000;
x = linspace(0,4*pi,numpoints);
y = sin(x);
for k = 1:numpoints
    addpoints(h,x(k),y(k))
    drawnow limitrate
end
Run through several iterations of the animation loop before drawing the updates on the screen. Use this technique when drawnow is too slow and drawnow limitrate is too fast.
For example, update the screen every 1/30 seconds. Use the tic and toc commands to keep track of how much time passes between screen updates.
h = animatedline;
axis([0,4*pi,-1,1])
numpoints = 10000;
x = linspace(0,4*pi,numpoints);
y = sin(x);
a = tic; % start timer
for k = 1:numpoints
    addpoints(h,x(k),y(k))
    b = toc(a); % check timer
    if b > (1/30)
        drawnow % update screen every 1/30 seconds
        a = tic; % reset timer after updating
    end
end
drawnow % draw final frame
A smaller interval updates the screen more often and results in a slower animation. For example, use b > (1/1000) to slow down the animation.
Input Arguments
Name-Value Arguments
Specify optional pairs of arguments as
Name1=Value1,...,NameN=ValueN, where Name is
the argument name and Value is the corresponding value.
Name-value arguments must appear after other arguments, but the order of the
pairs does not matter.
Example: animatedline(x,y,Color="red",Marker="o") creates an
animated line with red circular markers.
The animated line properties listed here are only a subset. For a complete list, see AnimatedLine Properties.
Alternatively, you can specify some common colors by name. This table lists the named color options, the equivalent RGB triplets, and the hexadecimal color codes.
| Color Name | Short Name | RGB Triplet | Hexadecimal Color Code | Appearance |
|---|---|---|---|---|
"red" | "r" | [1 0 0] | "#FF0000" |
|
"green" | "g" | [0 1 0] | "#00FF00" |
|
"blue" | "b" | [0 0 1] | "#0000FF" |
|
"cyan"
| "c" | [0 1 1] | "#00FFFF" |
|
"magenta" | "m" | [1 0 1] | "#FF00FF" |
|
"yellow" | "y" | [1 1 0] | "#FFFF00" |
|
"black" | "k" | [0 0 0] | "#000000" |
|
"white" | "w" | [1 1 1] | "#FFFFFF" |
|
"none" | Not applicable | Not applicable | Not applicable | No color |
This table lists the default color palettes for plots in the light and dark themes.
| Palette | Palette Colors |
|---|---|
Before R2025a: Most plots use these colors by default. |
|
|
|
You can get the RGB triplets and hexadecimal color codes for these palettes using the orderedcolors and rgb2hex functions. For example, get the RGB triplets for the "gem" palette and convert them to hexadecimal color codes.
RGB = orderedcolors("gem");
H = rgb2hex(RGB);
Before R2023b: Get the RGB triplets using RGB =
get(groot,"FactoryAxesColorOrder").
Before R2024a: Get the hexadecimal color codes using H =
compose("#%02X%02X%02X",round(RGB*255)).
Line style, specified as one of the options listed in this table.
| Line Style | Description | Resulting Line |
|---|---|---|
"-" | Solid line |
|
"--" | Dashed line |
|
":" | Dotted line |
|
"-." | Dash-dotted line |
|
"none" | No line | No line |
Marker symbol, specified as one of the values listed in this table. By default, the object does not display markers. Specifying a marker symbol adds markers at each data point or vertex.
| Marker | Description | Resulting Marker |
|---|---|---|
"o" | Circle |
|
"+" | Plus sign |
|
"*" | Asterisk |
|
"." | Point |
|
"x" | Cross |
|
"_" | Horizontal line |
|
"|" | Vertical line |
|
"square" | Square |
|
"diamond" | Diamond |
|
"^" | Upward-pointing triangle |
|
"v" | Downward-pointing triangle |
|
">" | Right-pointing triangle |
|
"<" | Left-pointing triangle |
|
"pentagram" | Pentagram |
|
"hexagram" | Hexagram |
|
"none" | No markers | Not applicable |
Marker outline color, specified as "auto", an RGB triplet, a
hexadecimal color code, a color name, or a short name. The default value of
"auto" uses the same color as the Color
property.
For a custom color, specify an RGB triplet or a hexadecimal color code.
An RGB triplet is a three-element row vector whose elements specify the intensities of the red, green, and blue components of the color. The intensities must be in the range
[0,1], for example,[0.4 0.6 0.7].A hexadecimal color code is a string scalar or character vector that starts with a hash symbol (
#) followed by three or six hexadecimal digits, which can range from0toF. The values are not case sensitive. Therefore, the color codes"#FF8800","#ff8800","#F80", and"#f80"are equivalent.
Alternatively, you can specify some common colors by name. This table lists the named color options, the equivalent RGB triplets, and the hexadecimal color codes.
| Color Name | Short Name | RGB Triplet | Hexadecimal Color Code | Appearance |
|---|---|---|---|---|
"red" | "r" | [1 0 0] | "#FF0000" |
|
"green" | "g" | [0 1 0] | "#00FF00" |
|
"blue" | "b" | [0 0 1] | "#0000FF" |
|
"cyan"
| "c" | [0 1 1] | "#00FFFF" |
|
"magenta" | "m" | [1 0 1] | "#FF00FF" |
|
"yellow" | "y" | [1 1 0] | "#FFFF00" |
|
"black" | "k" | [0 0 0] | "#000000" |
|
"white" | "w" | [1 1 1] | "#FFFFFF" |
|
"none" | Not applicable | Not applicable | Not applicable | No color |
This table lists the default color palettes for plots in the light and dark themes.
| Palette | Palette Colors |
|---|---|
Before R2025a: Most plots use these colors by default. |
|
|
|
You can get the RGB triplets and hexadecimal color codes for these palettes using the orderedcolors and rgb2hex functions. For example, get the RGB triplets for the "gem" palette and convert them to hexadecimal color codes.
RGB = orderedcolors("gem");
H = rgb2hex(RGB);
Before R2023b: Get the RGB triplets using RGB =
get(groot,"FactoryAxesColorOrder").
Before R2024a: Get the hexadecimal color codes using H =
compose("#%02X%02X%02X",round(RGB*255)).
Marker fill color, specified as "auto", an RGB triplet, a hexadecimal
color code, a color name, or a short name. The "auto" option uses the
same color as the Color property of the parent axes. If you specify
"auto" and the axes plot box is invisible, the marker fill color is
the color of the figure.
For a custom color, specify an RGB triplet or a hexadecimal color code.
An RGB triplet is a three-element row vector whose elements specify the intensities of the red, green, and blue components of the color. The intensities must be in the range
[0,1], for example,[0.4 0.6 0.7].A hexadecimal color code is a string scalar or character vector that starts with a hash symbol (
#) followed by three or six hexadecimal digits, which can range from0toF. The values are not case sensitive. Therefore, the color codes"#FF8800","#ff8800","#F80", and"#f80"are equivalent.
Alternatively, you can specify some common colors by name. This table lists the named color options, the equivalent RGB triplets, and the hexadecimal color codes.
| Color Name | Short Name | RGB Triplet | Hexadecimal Color Code | Appearance |
|---|---|---|---|---|
"red" | "r" | [1 0 0] | "#FF0000" |
|
"green" | "g" | [0 1 0] | "#00FF00" |
|
"blue" | "b" | [0 0 1] | "#0000FF" |
|
"cyan"
| "c" | [0 1 1] | "#00FFFF" |
|
"magenta" | "m" | [1 0 1] | "#FF00FF" |
|
"yellow" | "y" | [1 1 0] | "#FFFF00" |
|
"black" | "k" | [0 0 0] | "#000000" |
|
"white" | "w" | [1 1 1] | "#FFFFFF" |
|
"none" | Not applicable | Not applicable | Not applicable | No color |
This table lists the default color palettes for plots in the light and dark themes.
| Palette | Palette Colors |
|---|---|
Before R2025a: Most plots use these colors by default. |
|
|
|
You can get the RGB triplets and hexadecimal color codes for these palettes using the orderedcolors and rgb2hex functions. For example, get the RGB triplets for the "gem" palette and convert them to hexadecimal color codes.
RGB = orderedcolors("gem");
H = rgb2hex(RGB);
Before R2023b: Get the RGB triplets using RGB =
get(groot,"FactoryAxesColorOrder").
Before R2024a: Get the hexadecimal color codes using H =
compose("#%02X%02X%02X",round(RGB*255)).
Output Arguments
Limitations
Animated lines do not support data tips.