Colormap Editor
Open colormap editor
Description
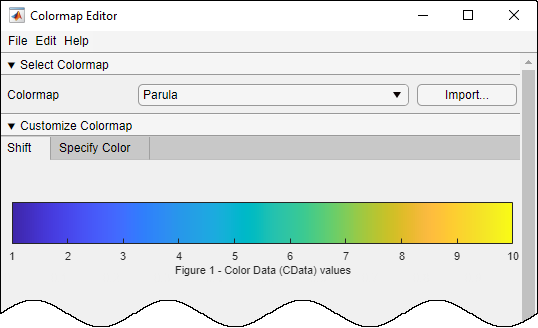
The Colormap Editor allows you to customize the colormap of the selected figure or axes. See the More About section for more information about colormaps.
Using the Colormap Editor, you can:
Choose a predefined colormap.
Import a saved colormap from the workspace.
Adjust the position of colors in the colormap.
Change the color at a specific position.
Save a custom colormap to the workspace.
MATLAB® applies your changes to the colormap of the selected figure or axes.
Open the Colormap Editor
MATLAB command prompt: Enter colormapeditor.
Examples
Load the mri dataset and display one of the image
slices.
load mri
imagesc(D(:,:,1,11))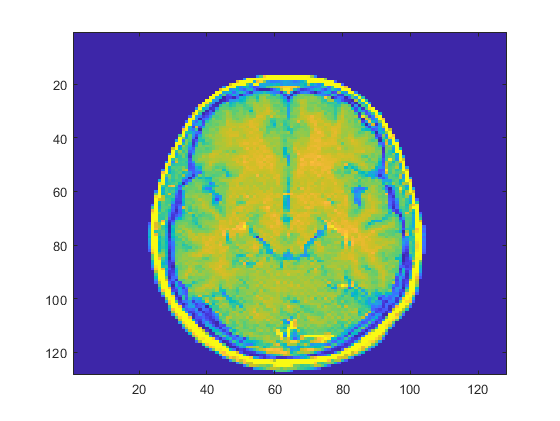
Open the Colormap Editor. Change the colormap to Hot using the drop-down menu.
colormapeditor


Adjust the colormap by clicking and dragging the red section to the right.
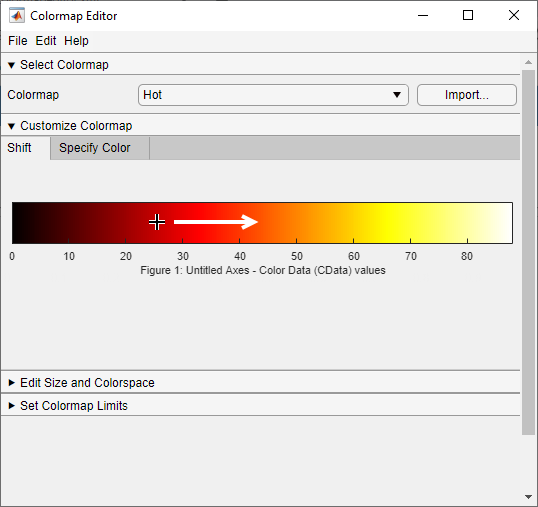
The new colormap provides more detail near the center of the image.

Select File > Save as or press Ctrl+S to save the new colormap to the workspace.
Parameters
Customize Colormap
Color markers allow you to change the color and length of transitions in the colormap. View and adjust color markers by opening the Specify Color tab.
![]()
This table describes the adjustments you can make.
Adjustment | Adjustment Instructions |
|---|---|
Add a color marker | Click the displayed colormap. You can also
specify |
Select a marker | Click the marker. |
Select multiple markers | Click the first marker. Then hold the Ctrl key as you click the other markers. |
Move a marker | Click and drag the marker. Alternatively, select the marker and press the left and right arrow keys. You can move only one marker at a time. |
Delete a marker | Select the marker and then press the Delete key. |
Delete multiple markers | Select the markers and then press the Delete key. |
Change marker color | Double-click the marker and then choose a color from the drop-down menu. |
Index of the color marker, specified as a positive integer between 1 and
Size. View the index of a color marker by clicking
on it. Add a new marker by specifying Current
Index.
This parameter is read-only.
Color data value in the CData property of the
graphics object using the colormap, specified as a number between
CLim Minimum and CLim
Maximum.
Edit Size and Colorspace
Number of colors, specified as an integer in the range [1, 1000].
Interpolating colorspace, specified as one of these values:
RGB — MATLAB calculates values in the new colormap by linearly interpolating the red, green, and blue components of color.
HSV — MATLAB calculates values in the new colormap by linearly interpolating the hue, saturation, and value coordinates. Hue corresponds to the values on a color wheel that transition from red to orange, yellow, green, cyan, blue, magenta, and finally back to red. Hue interpolation is calculated as the shortest distance between adjacent colors on the color wheel.
When you change the colorspace, the Colormap Editor preserves the number, color, and location of markers, which can cause the colormap to change.
Colormap reversal, specified as one of these values:
on– Reverse the order of colors in the displayed colormap.off– Do not reverse the colormap.
These images show the parula colormap with
Reverse specified as off and
on.
off | on |
|---|---|
|
|
|
Set Colormap Limits
Colormap lower limit, specified as a number. All values in your plot data
that are less than or equal to the value of CLim
Minimum map to the first color in the colormap. All values
between CLim Minimum and CLim
Maximum map linearly to the intermediate colors of the
colormap.
When you change CLim Minimum and CLim
Maximum, those changes are reflected in the CLim property of the
plotting axes.
Colormap upper limit, specified as a number. All values in your plot data
that are greater than or equal to the value of CLim
Maximum map to the last color in the colormap. All values
between CLim Minimum and CLim
Maximum map linearly to the intermediate colors of the
colormap.
When you change CLim Minimum and CLim
Maximum, those changes are reflected in the CLim property of the
plotting axes.
More About
A colormap is a matrix of values that define the colors for graphics objects such as surface, image, and patch objects. MATLAB draws the objects by mapping data values to colors in the colormap.
Colormaps can be any length, but must be three columns wide. Each row in the matrix
defines one color using an RGB triplet. An RGB triplet is a three-element row vector whose
elements specify the intensities of the red, green, and blue components of the color.
Typically, the intensities are double or single values
in the range [0, 1]. A value of 0 indicates no color and a value of
1 indicates full intensity. For example, this command creates a
colormap that has five colors: black, red, green, blue, and
white.
mymap = [0 0 0
1 0 0
0 1 0
0 0 1
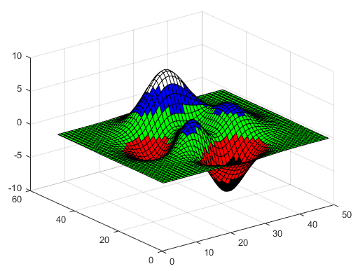
1 1 1];To change the color scheme of a visualization, call the colormap
function to change the colormap of the containing axes or figure. For example, these
commands create a surface plot and set the colormap of the figure to
mymap.
surf(peaks)
colormap(mymap)
Tips
To import a colormap from the workspace, select Import or press Ctrl+I.
To save a colormap to the workspace after making changes, select File > Save as or press Ctrl+S. Use the
savefunction to save a colormap as a MAT-file for use in future sessions. Apply a saved colormap to a figure, axes, or chart using thecolormapfunction.
Version History
Introduced before R2006a