Main Content

griddata

Interpolate 2-D or 3-D scattered data

Description

example

vq = griddata(x,y,v,xq,yq) fits a surface of the form v = f(x,y) to the scattered data in the vectors (x,y,v). The griddata function interpolates the surface at the query points specified by (xq,yq) and returns the interpolated values, vq. The surface always passes through the data points defined by x and y.

example

vq = griddata(x,y,z,v,xq,yq,zq) fits a hypersurface of the form v = f(x,y,z).

vq = griddata(___,method) specifies the interpolation method used to compute vq using any of the input arguments in the previous syntaxes. method can be "linear", "nearest", "natural", "cubic", or "v4". The default method is "linear".

[Xq,Yq,vq] = griddata(x,y,v,xq,yq) and [Xq,Yq,vq] = griddata(x,y,v,xq,yq,method) additionally return Xq and Yq, which contain the grid coordinates for the query points.

Examples

collapse all

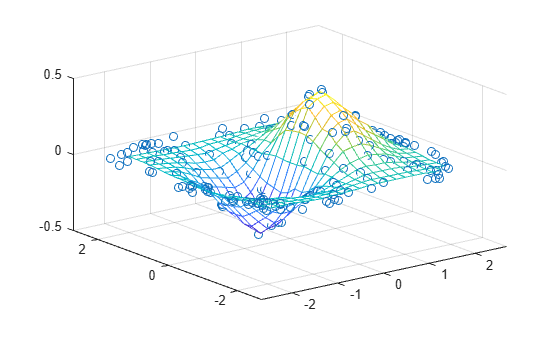
Interpolate random scattered data on a uniform grid of query points.

Sample a function at 200 random points between -2.5 and 2.5. The resulting vectors x, y, and v contain scattered sample points and data values at those points.

rng default
xy = -2.5 + 5*rand([200 2]);
x = xy(:,1);
y = xy(:,2);
v = x.*exp(-x.^2-y.^2);

Define a grid of query points and interpolate the scattered data over the grid.

[xq,yq] = meshgrid(-2:.2:2, -2:.2:2);
vq = griddata(x,y,v,xq,yq);

Plot the gridded data as a mesh and the scattered data as dots.

mesh(xq,yq,vq)
hold on
plot3(x,y,v,"o")
xlim([-2.7 2.7])
ylim([-2.7 2.7])

Figure contains an axes object. The axes object contains 2 objects of type surface, line. One or more of the lines displays its values using only markers

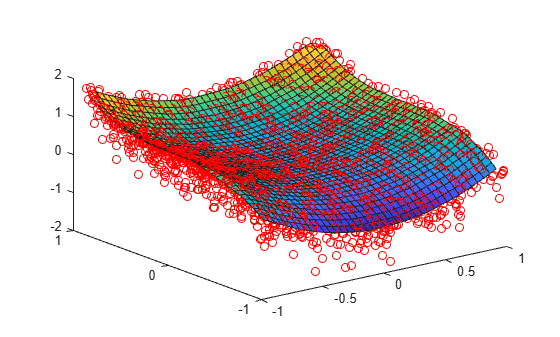
Interpolate a 3-D slice of a 4-D function that is sampled at randomly scattered points.

Sample a 4-D function v(x,y,z) at 2500 random points between -1 and 1. The vectors x, y, and z contain the nonuniform sample points.

x = 2*rand(2500,1) - 1; 
y = 2*rand(2500,1) - 1; 
z = 2*rand(2500,1) - 1;
v = x.^2 + y.^3 - z.^4;

Create a grid with xy points in the range [-1, 1], and set z=0. Interpolating on this grid of 2-D query points (xq,yq,0) produces a 3-D interpolated slice (xq,yq,0,vq) of the 4-D data set (x,y,z,v).

d = -1:0.05:1;
[xq,yq,zq] = meshgrid(d,d,0);

Interpolate the scattered data on the grid. Plot the results.

vq = griddata(x,y,z,v,xq,yq,zq);
plot3(x,y,v,"ro")
hold on
surf(xq,yq,vq)
hold off

Figure contains an axes object. The axes object contains 2 objects of type line, surface. One or more of the lines displays its values using only markers

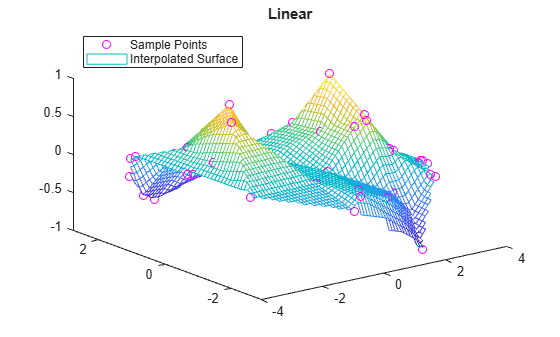
Compare the results of several different interpolation algorithms offered by griddata.

Create a sample data set of 50 scattered points. The number of points is artificially small to highlight the differences between the interpolation methods.

x = -3 + 6*rand(50,1);
y = -3 + 6*rand(50,1);
v = sin(x).^4 .* cos(y);

Create a grid of query points.

[xq,yq] = meshgrid(-3:0.1:3);

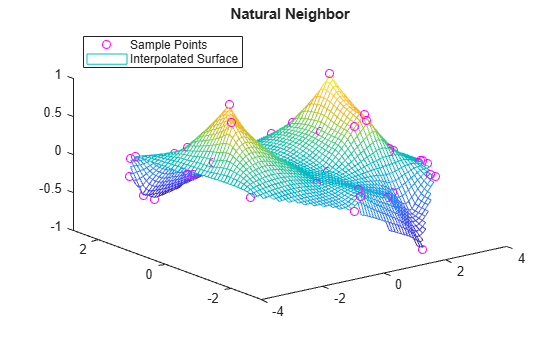
Interpolate the sample data using the "nearest", "linear", "natural", and "cubic" methods. Plot the results for comparison.

z1 = griddata(x,y,v,xq,yq,"nearest");
plot3(x,y,v,"mo")
hold on
mesh(xq,yq,z1)
title("Nearest Neighbor")
legend("Sample Points","Interpolated Surface","Location","NorthWest")

Figure contains an axes object. The axes object with title Nearest Neighbor contains 2 objects of type line, surface. One or more of the lines displays its values using only markers These objects represent Sample Points, Interpolated Surface.

z2 = griddata(x,y,v,xq,yq,"linear");
figure
plot3(x,y,v,"mo")
hold on
mesh(xq,yq,z2)
title("Linear")
legend("Sample Points","Interpolated Surface","Location","NorthWest")

Figure contains an axes object. The axes object with title Linear contains 2 objects of type line, surface. One or more of the lines displays its values using only markers These objects represent Sample Points, Interpolated Surface.

z3 = griddata(x,y,v,xq,yq,"natural");
figure
plot3(x,y,v,"mo")
hold on
mesh(xq,yq,z3)
title("Natural Neighbor")
legend("Sample Points","Interpolated Surface","Location","NorthWest")

Figure contains an axes object. The axes object with title Natural Neighbor contains 2 objects of type line, surface. One or more of the lines displays its values using only markers These objects represent Sample Points, Interpolated Surface.

z4 = griddata(x,y,v,xq,yq,"cubic");
figure
plot3(x,y,v,"mo")
hold on
mesh(xq,yq,z4)
title("Cubic")
legend("Sample Points","Interpolated Surface","Location","NorthWest")

Figure contains an axes object. The axes object with title Cubic contains 2 objects of type line, surface. One or more of the lines displays its values using only markers These objects represent Sample Points, Interpolated Surface.

Plot the exact solution.

figure
plot3(x,y,v,"mo")
hold on
mesh(xq,yq,sin(xq).^4 .* cos(yq))
title("Exact Solution")
legend("Sample Points","Exact Surface","Location","NorthWest")

Figure contains an axes object. The axes object with title Exact Solution contains 2 objects of type line, surface. One or more of the lines displays its values using only markers These objects represent Sample Points, Exact Surface.

Input Arguments

collapse all

Sample point coordinates, specified as vectors. Corresponding elements in x, y, and z specify the xyz coordinates of points where the sample values v are known. The sample points must be unique.

Data Types: double

Sample values, specified as a vector. The sample values in v correspond to the sample points in x, y, and z.

If v contains complex numbers, then griddata interpolates the real and imaginary parts separately.

Data Types: double
Complex Number Support: Yes

Query points, specified as vectors or arrays. Corresponding elements in the vectors or arrays specify the xyz coordinates of the query points. The query points are the locations where griddata performs interpolation.

  • Specify arrays if you want to pass a grid of query points. Use ndgrid or meshgrid to construct the arrays.

  • Specify vectors if you want to pass a collection of scattered points.

The specified query points must lie inside the convex hull of the sample data points. griddata returns NaN for query points outside of the convex hull.

Data Types: double

Interpolation method, specified as one of the methods in this table.

MethodDescriptionContinuity
"linear"Triangulation-based linear interpolation (default) supporting 2-D and 3-D interpolation.C0
"nearest"Triangulation-based nearest neighbor interpolation supporting 2-D and 3-D interpolation.Discontinuous
"natural"Triangulation-based natural neighbor interpolation supporting 2-D and 3-D interpolation. This method is an efficient tradeoff between linear and cubic.C1 except at sample points
"cubic"Triangulation-based cubic interpolation supporting 2-D interpolation only.C2
"v4"

Biharmonic spline interpolation (MATLAB® 4 griddata method) supporting 2-D interpolation only. Unlike the other methods, this interpolation is not based on a triangulation.

C2

Data Types: char | string

Output Arguments

collapse all

Interpolated values, returned as a vector or array. The size of vq depends on the size of the query point inputs xq, yq, and zq:

  • For 2-D interpolation, where xq and yq specify an m-by-n grid of query points, vq is an m-by-n array.

  • For 3-D interpolation, where xq, yq, and zq specify an m-by-n-by-p grid of query points, vq is an m-by-n-by-p array.

  • If xq, yq, (and zq for 3-D interpolation) are vectors that specify scattered points, then vq is a vector of the same length.

For all interpolation methods other than "v4", the output vq contains NaN values for query points outside the convex hull of the sample data. The "v4" method performs the same calculation for all points regardless of location.

Grid coordinates for query points, returned as vectors or matrices. The shape of Xq and Yq depends on how you specify xq and yq:

  • If you specify xq as a row vector and yq as a column vector, then griddata uses those grid vectors to form a full grid with [Xq,Yq] = meshgrid(xq,yq). In this case, the Xq and Yq outputs are returned as matrices that contain the full grid coordinates for the query points.

  • If xq and yq are both row vectors or both column vectors, then Xq = xq and Yq = yq.

Tips

  • Scattered data interpolation with griddata uses a Delaunay triangulation of the data, so can be sensitive to scaling issues in x, y, and z. When this occurs, you can use normalize to rescale the data and improve the results. See Normalize Data with Differing Magnitudes for more information.

Extended Capabilities

Version History

Introduced before R2006a