ribbon
Ribbon plot
Description
ribbon( plots the columns of
Z)Z as three-dimensional ribbons of uniform width, where
y-coordinates range from 1 to the number of rows in
Z. Ribbons advance along the x-axis centered at unit
intervals.
ribbon(___, sets
properties of the ribbon plot using one or more name-value arguments. For example you can
specify the color and transparency of the ribbons. For a list of properties, see Surface Properties. (since R2024b)Name=Value)
s = ribbon(___) returns a vector of
Surface objects with one object per ribbon. Use s to
modify properties of the plot after creating it. For a list of properties, see Surface Properties.
Examples
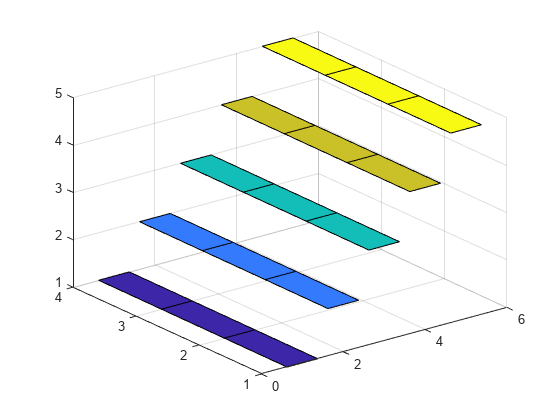
Create a plot with five ribbons at increasing heights. First, create a 5-by-5 matrix with elements corresponding to ribbon heights.
Z = repmat(1:5,4,1)
Z = 4×5

     1     2     3     4     5
     1     2     3     4     5
     1     2     3     4     5
     1     2     3     4     5
Each column of Z represents one ribbon, plotted at a constant x-coordinate corresponding to the column number and with y-coordinates corresponding to the row numbers of Z.
ribbon(Z)
Create a 5-by-5 matrix with the magic function.
Z = magic(5)
Z = 5×5

    17    24     1     8    15
    23     5     7    14    16
     4     6    13    20    22
    10    12    19    21     3
    11    18    25     2     9
Create a ribbon plot of the matrix and specify the y-coordinates so each ribbon is centered at 0.
Y = [-2 -1 0 1 2];
ribbon(Y,Z);

Plot three ribbons at different locations along the y-axis. Specify the y-coordinates of the ribbons as a matrix Y that is the same size as Z, the matrix of ribbon heights. Each column of Y corresponds to one ribbon.
Y = [1 2 3;
     2 3 4;
     3 4 5;
     4 5 6];
Z = Y;
ribbon(Y,Z)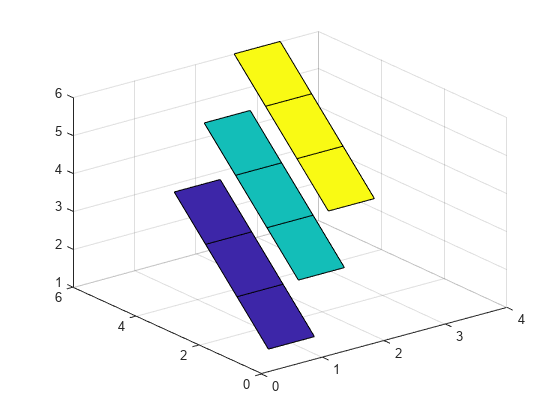
Create a ribbon plot and set the width of each ribbon to 30% of the total space available.
Z = magic(5);
Y = [-2 -1 0 1 2];
ribbon(Y,Z,0.3)
Create a ribbon plot and specify an output argument. The output is a vector of five Surface objects, where each object corresponds to one ribbon.
Z = magic(5);
Y = [-2 -1 0 1 2];
s = ribbon(Y,Z)
s =
  5×1 Surface array:

  Surface
  Surface
  Surface
  Surface
  Surface
Highlight the first ribbon by changing the EdgeColor and LineWidth properties of the corresponding Surface object.
s(1).EdgeColor = "yellow";
s(1).LineWidth = 3;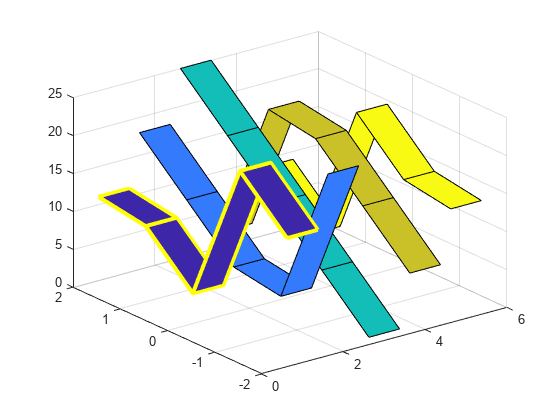
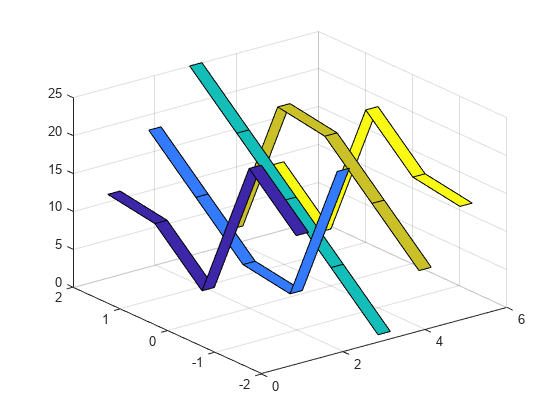
Create a ribbon plot with 30 ribbons and a colorbar.
t = linspace(0,2*pi,30);
x = sin(t)';
y = cos(t);
ribbon(x*y)
cbar = colorbar;
cbar.Label.String= "Ribbon Number";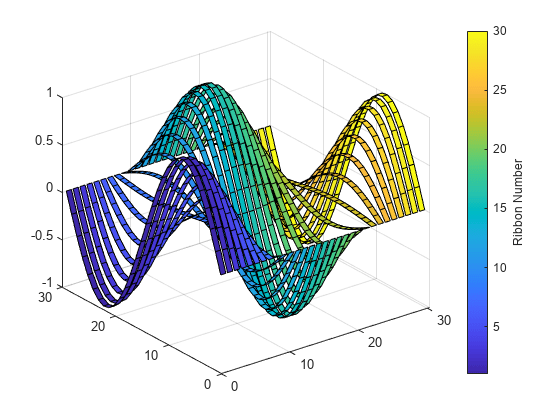
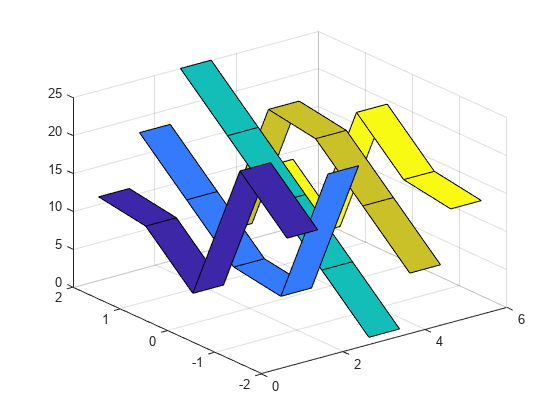
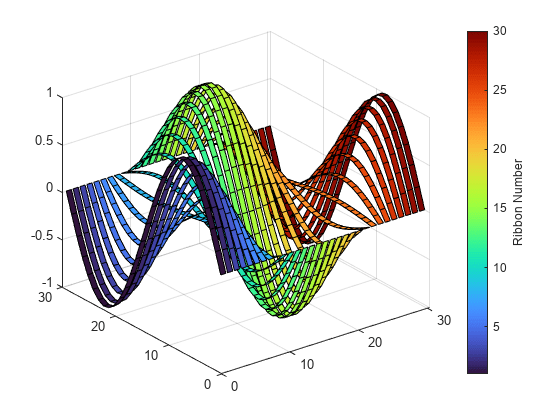
Change the ribbon colors using the colormap function. ribbon maps the x-coordinates of the ribbons to colors in the colormap linearly.
colormap(turbo)
Input Arguments
Name-Value Arguments
Specify optional pairs of arguments as
Name1=Value1,...,NameN=ValueN, where Name is
the argument name and Value is the corresponding value.
Name-value arguments must appear after other arguments, but the order of the
pairs does not matter.
Example: ribbon([1 2 3; 1 2 3],FaceColor="red") creates a red ribbon
plot.
Note
The properties listed here are only a subset. For a full list, see Surface Properties.
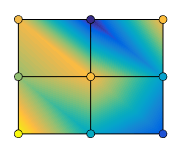
Face color, specified as one of the values in this table.
| Value | Description |
|---|---|
'flat' | Use a different color for each face based on the values
in the
|
'interp' |
Use interpolated coloring for each face based on the values in the
|
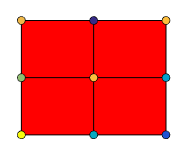
| RGB triplet, hexadecimal color code, or color name |
Use the specified color for all the faces. This option does not use the color
values in the
|
'texturemap' | Transform the color data in CData so that
it conforms to the surface. |
'none' | Do not draw the faces. |
RGB triplets and hexadecimal color codes are useful for specifying custom colors.
An RGB triplet is a three-element row vector whose elements specify the intensities of the red, green, and blue components of the color. The intensities must be in the range
[0,1]; for example,[0.4 0.6 0.7].A hexadecimal color code is a character vector or a string scalar that starts with a hash symbol (
#) followed by three or six hexadecimal digits, which can range from0toF. The values are not case sensitive. Thus, the color codes"#FF8800","#ff8800","#F80", and"#f80"are equivalent.
Alternatively, you can specify some common colors by name. This table lists the named color options, the equivalent RGB triplets, and hexadecimal color codes.
| Color Name | Short Name | RGB Triplet | Hexadecimal Color Code | Appearance |
|---|---|---|---|---|
"red" | "r" | [1 0 0] | "#FF0000" |
|
"green" | "g" | [0 1 0] | "#00FF00" |
|
"blue" | "b" | [0 0 1] | "#0000FF" |
|
"cyan"
| "c" | [0 1 1] | "#00FFFF" |
|
"magenta" | "m" | [1 0 1] | "#FF00FF" |
|
"yellow" | "y" | [1 1 0] | "#FFFF00" |
|
"black" | "k" | [0 0 0] | "#000000" |
|
"white" | "w" | [1 1 1] | "#FFFFFF" |
|
This table lists the default color palettes for plots in the light and dark themes.
| Palette | Palette Colors |
|---|---|
Before R2025a: Most plots use these colors by default. |
|
|
|
You can get the RGB triplets and hexadecimal color codes for these palettes using the orderedcolors and rgb2hex functions. For example, get the RGB triplets for the "gem" palette and convert them to hexadecimal color codes.
RGB = orderedcolors("gem");
H = rgb2hex(RGB);
Before R2023b: Get the RGB triplets using RGB =
get(groot,"FactoryAxesColorOrder").
Before R2024a: Get the hexadecimal color codes using H =
compose("#%02X%02X%02X",round(RGB*255)).
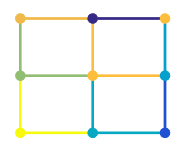
Edge line color, specified as one of the values listed in this table.
| Value | Description |
|---|---|
"none" | Do not draw the edges. |
"flat" | Use a different color for each edge based on the values in the
|
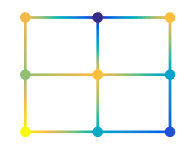
"interp" | Use interpolated coloring for each edge based on the values in the
|
| RGB triplet, hexadecimal color code, or color name |
Use the specified color for all the edges. This option does not use the color
values in the
|
RGB triplets and hexadecimal color codes are useful for specifying custom colors.
An RGB triplet is a three-element row vector whose elements specify the intensities of the red, green, and blue components of the color. The intensities must be in the range
[0,1]; for example,[0.4 0.6 0.7].A hexadecimal color code is a character vector or a string scalar that starts with a hash symbol (
#) followed by three or six hexadecimal digits, which can range from0toF. The values are not case sensitive. Thus, the color codes"#FF8800","#ff8800","#F80", and"#f80"are equivalent.
Alternatively, you can specify some common colors by name. This table lists the named color options, the equivalent RGB triplets, and hexadecimal color codes.
| Color Name | Short Name | RGB Triplet | Hexadecimal Color Code | Appearance |
|---|---|---|---|---|
"red" | "r" | [1 0 0] | "#FF0000" |
|
"green" | "g" | [0 1 0] | "#00FF00" |
|
"blue" | "b" | [0 0 1] | "#0000FF" |
|
"cyan"
| "c" | [0 1 1] | "#00FFFF" |
|
"magenta" | "m" | [1 0 1] | "#FF00FF" |
|
"yellow" | "y" | [1 1 0] | "#FFFF00" |
|
"black" | "k" | [0 0 0] | "#000000" |
|
"white" | "w" | [1 1 1] | "#FFFFFF" |
|
This table lists the default color palettes for plots in the light and dark themes.
| Palette | Palette Colors |
|---|---|
Before R2025a: Most plots use these colors by default. |
|
|
|
You can get the RGB triplets and hexadecimal color codes for these palettes using the orderedcolors and rgb2hex functions. For example, get the RGB triplets for the "gem" palette and convert them to hexadecimal color codes.
RGB = orderedcolors("gem");
H = rgb2hex(RGB);
Before R2023b: Get the RGB triplets using RGB =
get(groot,"FactoryAxesColorOrder").
Before R2024a: Get the hexadecimal color codes using H =
compose("#%02X%02X%02X",round(RGB*255)).