Main Content

set

Set graphics object properties

    Description

    example

    set(h,Name,Value) sets properties for the specified graphics object h using one or more name-value arguments. If h is a vector of objects, then set sets the properties for all the objects in h. If h is empty ([ ]), set does nothing and does not return an error or warning.

    For more information about properties that you can set, see the property pages for each object, for example, Figure Properties, Axes Properties, Line Properties, and Text Properties.

    set(h,defaultTypeProperty,defaultValue) changes the default value of the specified property and object type for the specified graphics object h using one or more pairs of property names and values. defaultTypeProperty is the word default concatenated with the object type (for example, Figure) and the property name (for example, Color) in quotes. For example, set(groot,"defaultFigureColor","red") changes the default value of the Color property of Figure objects to red for the graphics root object, groot.

    example

    set(h,NameArray,ValueArray) sets multiple properties for the specified graphics object h.

    • If h is a scalar object, specify NameArray and ValueArray as 1-by-n cell arrays containing one or more property names or values, where n is the number of properties being set.

    • If h is a vector of objects, to set a different property value for each object in h, specify ValueArray as an m-by-n cell array, where m is the number of elements in h and n is the number of property names contained in NameArray.

    example

    set(h,a) sets multiple properties using a, which is a structure whose field names are the object property names and whose field values are the corresponding property values. If a is empty, set does nothing and does not return an error or warning.

    example

    s = set(h) returns the user-settable properties and possible values for the specified graphics object h. h must be a single object. This syntax does not change the properties of h.

    If s is not specified, set displays the user-settable properties and possible values in the Command Window.

    v = set(h,propertyName) returns the possible values for the specified property. If the possible values are character vectors or strings, set returns a cell array containing the values. For other properties that do not have a fixed set of values, set returns an empty cell array. h must be a single object. This syntax does not change the properties of h.

    If v is not specified, set displays the possible values in the Command Window.

    Examples

    collapse all

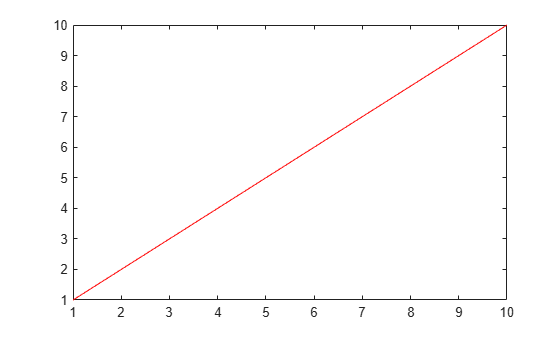
    Create a line plot and return the Line object as p. Set the Color property of the line to "red".

    p = plot(1:10);
    set(p,"Color","red")

    Figure contains an axes object. The axes object contains an object of type line.

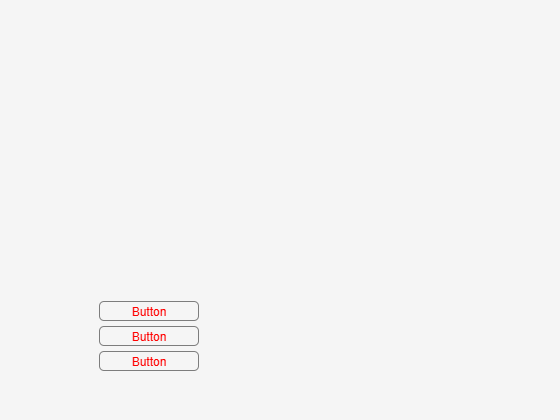
    Create a figure with three buttons and put them into the array btns. Set the FontColor property of all the buttons to "red".

    fig = uifigure;
    btn1 = uibutton(fig,"Position",[100 100 100 20]);
    btn2 = uibutton(fig,"Position",[100 75 100 20]);
    btn3 = uibutton(fig,"Position",[100 50 100 20]);
    btns = [btn1 btn2 btn3];
    set(btns,"FontColor","red")

    Figure contains objects of type uibutton.

    Create a plot with four lines using random data, and return the four Line objects as p. Set the LineStyle property of each of the four Line objects to a different value. Transpose the list of LineStyle values from a row vector to a column vector to match the shape of p.

    p = plot(rand(4));
    NameArray = {'LineStyle'};
    ValueArray = transpose({'-','--',':','-.'});
    set(p,NameArray,ValueArray)

    Figure contains an axes object. The axes object contains 4 objects of type line.

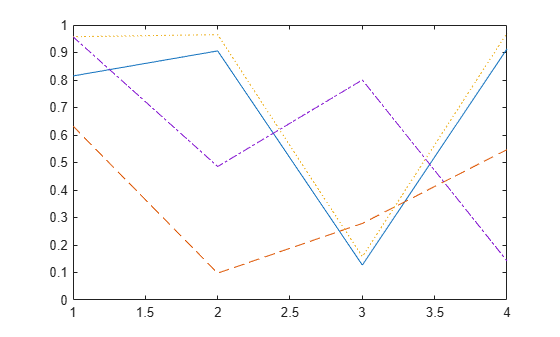
    Plot a discrete data sequence and return the three Stem objects as st. Set the Marker and Tag properties of the three different Stem objects to different values. Each row of the value cell array corresponds to an object in st and contains two values, one for the Marker property and one for the Tag property.

    x = 0:30;
    y = [1.5*cos(x); 4*exp(-.1*x).*cos(x); exp(.05*x).*cos(x)]';
    st = stem(x,y);
    NameArray = {'Marker','Tag'};
    ValueArray = {'o','Decaying Exponential'; ...
       'square','Growing Exponential'; ...
       '*','Steady State'};
    set(st,NameArray,ValueArray)

    Figure contains an axes object. The axes object contains 3 objects of type stem.

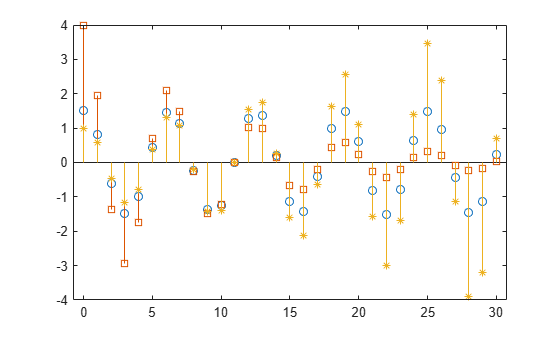
    Create a figure and return the user-settable properties and possible values for the figure.

    fig = uifigure;
    s = set(fig);

    Display the possible values for the Pointer property.

    s.Pointer
    ans = 17x1 cell
        {'arrow'    }
        {'ibeam'    }
        {'crosshair'}
        {'watch'    }
        {'topl'     }
        {'topr'     }
        {'botl'     }
        {'botr'     }
        {'circle'   }
        {'cross'    }
        {'fleur'    }
        {'custom'   }
        {'left'     }
        {'top'      }
        {'right'    }
        {'bottom'   }
        {'hand'     }


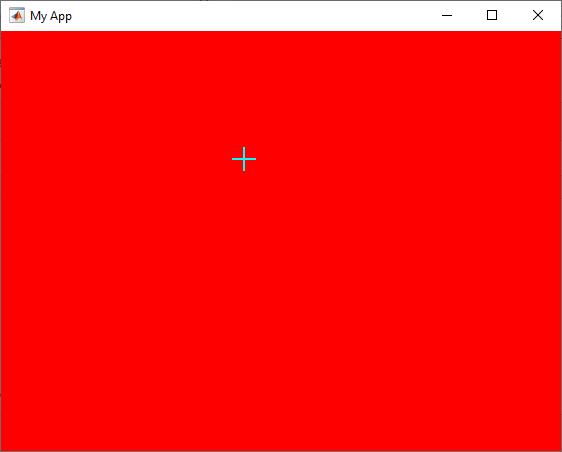
    Create a structure with Name, Color, and Pointer fields, and use the structure to set those properties for the figure.

    a.Name = "My App";
    a.Color = "red";
    a.Pointer = "crosshair";
    
    set(fig,a)

    Input Arguments

    collapse all

    Graphics objects, specified as a single object or a vector of objects.

    Note

    Do not use the set function on Java® objects as it will cause a memory leak. For more information, see Access Public and Private Data.

    Property and value pairs, specified as Name1=Value1,...,NameN=ValueN, where Name is the property name and Value is the corresponding value.

    Each type of object supports a different set of properties. For a full list of properties and descriptions for each type, see the associated object property page (for example, Figure Properties, Axes Properties, Line Properties, and Text Properties).

    To set property values, specify the name followed by an equal sign (=) and the corresponding value. For example, set(h,Color="red").

    Before R2021a, use commas to separate each name and value, and enclose Name in quotes. For example, set(h,"Color","red").

    To set a property to its default value, specify the property value as the word default in quotes. For example, set(h,"Color","default").

    For more information about setting default values, see Default Property Values.

    Default property and value pairs, specified as defaultTypeProperty1=defaultValue1,...,defaultTypePropertyN=defaultValueN, where defaultTypeProperty is the word default concatenated with the object type (for example, Figure) and the property name (for example, Color), and defaultValue is the corresponding default value.

    To change default property values, specify defaultTypeProperty followed by an equal sign (=) and the corresponding default value. For example, set(h,defaultFigureColor="red").

    Before R2021a, use commas to separate each name and value, and enclose Name in quotes. For example, set(h,"defaultFigureColor","red").

    To remove the default value for a property, specify the property value as the word remove in quotes. For example, set(h,"defaultFigureColor","remove").

    For more information about setting default values, see Default Property Values.

    Property names, specified as a cell array containing one or more property names.

    Property values, specified as an m-by-n cell array, where m is the number of elements in h and n is the number of property names contained in NameArray.

    Object property names and values, specified as a structure whose field names are the object property names and whose field values are the corresponding property values.

    Property name, specified as a string scalar or character vector.

    Output Arguments

    collapse all

    Property names and their values, returned as a structure. In the structure, the field names are the object property names, and the field values are the possible values of the corresponding properties.

    Possible property values, returned as a cell array. If the possible values are character vectors or strings, set returns a cell array containing the values. For other properties that do not have a fixed set of values, set returns an empty cell array.

    Tips

    • When setting the FontSize and FontUnits properties in the same set statement, specify the FontUnits property first. This order allows the set function to interpret the specified FontSize as intended. Similarly, when setting figure and axes units, set the Units property before setting additional properties whose values are calculated using the specified units. For example, this command sets the Units property before setting the Position property, whose measurements are in units specified by the Units property.

      f = figure;
      set(f,"Units","characters","Position",[30 30 120 35]);

    Version History

    Introduced before R2006a