smoothdata
Smooth noisy data
Syntax
Description
B = smoothdata(A)A using a moving average.
smoothdata determines the moving window size from the
entries in A. The window slides down the length of the
vector, computing an average over the elements within each window.
If
Ais a matrix, thensmoothdatacomputes the moving average down each column ofA.If
Ais a multidimensional array, thensmoothdataoperates along the first dimension ofAwhose size does not equal 1.If
Ais a table or timetable with numeric variables, thensmoothdataoperates on each variable ofAseparately.
B = smoothdata(___,Name,Value)t is a vector of time values, then
smoothdata(A,"SamplePoints",t) smooths the data in
A relative to the times in t.
[ also returns the moving window size.B,winsize]
= smoothdata(___)
Alternative
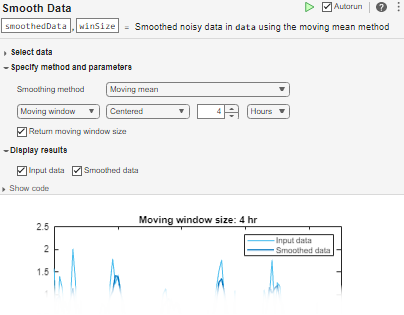
You can use smoothdata functionality interactively by
adding the Smooth
Data task to a live script.
Examples
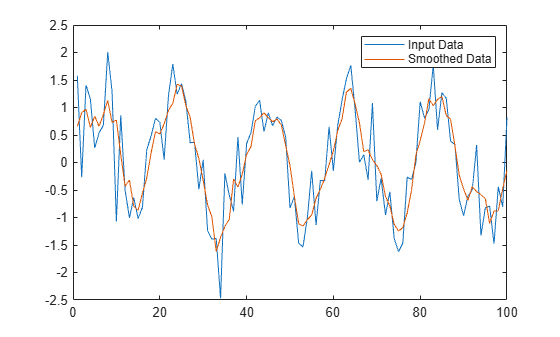
Create a vector containing noisy data, and smooth the data with a moving average.
x = 1:100;
rng(0,"twister")
A = cos(2*pi*0.05*x+2*pi*rand) + 0.5*randn(1,100);

B = smoothdata(A);
Plot the original and smoothed data.
plot(x,A)
hold on
plot(x,B)
legend("Input Data","Smoothed Data")
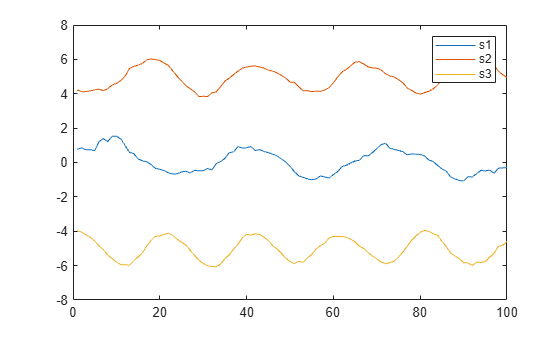
Create a matrix whose rows represent three noisy signals. Smooth the three signals using a moving average, and plot the smoothed data.
x = 1:100;
rng(0,"twister")
s1 = cos(2*pi*0.03*x+2*pi*rand) + 0.5*randn(1,100);
s2 = cos(2*pi*0.04*x+2*pi*rand) + 0.4*randn(1,100) + 5;
s3 = cos(2*pi*0.05*x+2*pi*rand) + 0.3*randn(1,100) - 5;
A = [s1; s2; s3];

B = smoothdata(A,2);

plot(x,B(1,:))
hold on
plot(x,B(2,:))
plot(x,B(3,:))
legend("s1","s2","s3")
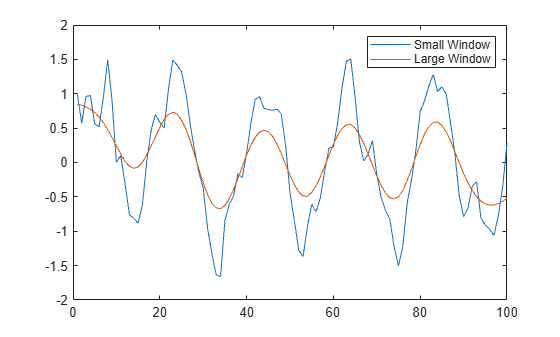
Smooth a vector of noisy data with a Gaussian-weighted moving average filter. Display the window size used by the filter.
x = 1:100;
rng(0,"twister")
A = cos(2*pi*0.05*x+2*pi*rand) + 0.5*randn(1,100);

[B,winsize] = smoothdata(A,"gaussian");
winsize
winsize =
4
Smooth the original data with a larger window containing 20 elements. Plot the smoothed data for both window sizes.
C = smoothdata(A,"gaussian",20);
plot(x,B)
hold on
plot(x,C)
legend("Small Window","Large Window")
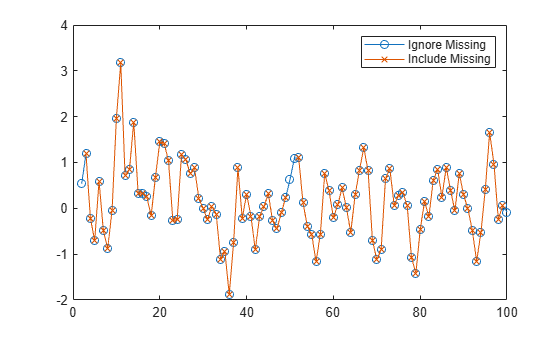
Create a noisy vector containing NaN values, and smooth the data ignoring NaN values.
rng(0,"twister")
A = [NaN randn(1,48) NaN randn(1,49) NaN];
B = smoothdata(A);
Smooth the data including NaN values. The average in a window containing any NaN value is NaN.
C = smoothdata(A,"includenan");Plot the smoothed data in B and C.
plot(1:100,B,"-o")
hold on
plot(1:100,C,"-x")
legend("Ignore Missing","Include Missing")
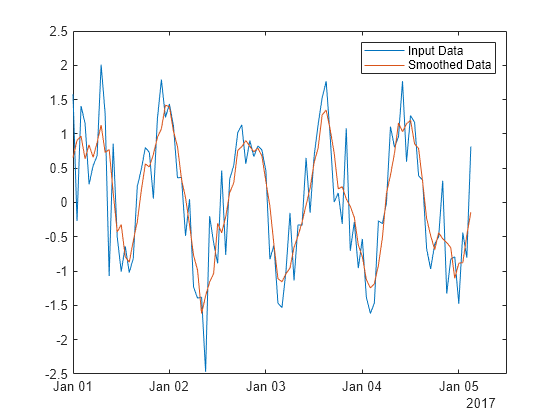
Create a vector of noisy data that corresponds to a time vector t. Smooth the data relative to the times in t, and plot the original data and the smoothed data.
x = 1:100;
rng(0,"twister")
A = cos(2*pi*0.05*x+2*pi*rand) + 0.5*randn(1,100);
t = datetime(2017,1,1,0,0,0) + hours(0:99);
B = smoothdata(A,"SamplePoints",t);

plot(t,A)
hold on
plot(t,B)
legend("Input Data","Smoothed Data")
Input Arguments
Input data, specified as a vector, matrix, multidimensional array, table,
or timetable. If A is a table or timetable, then either
the variables must be numeric, or you must use the
DataVariables name-value argument to list numeric
variables explicitly. Specifying variables is useful when you are working
with a table that also contains nonnumeric variables.
Data Types:
double | single |
int8 | int16 |
int32 | int64 |
uint8 | uint16 |
uint32 | uint64 |
logical | table |
timetable
Complex Number Support: Yes
Dimension to operate along, specified as a positive integer scalar. If you do not specify the dimension, then the default is the first array dimension whose size does not equal 1.
Consider an m-by-n input matrix,
A:
smoothdata(A,1)smooths the data in each column ofAand returns anm-by-nmatrix.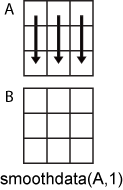
smoothdata(A,2)smooths the data in row ofAand returns anm-by-nmatrix.
For table or timetable input data, dim is not supported
and operation is along each table or timetable variable separately.
Smoothing method, specified as one of these values:
"movmean"— Average over each window ofA. This method is useful for reducing periodic trends in data."movmedian"— Median over each window ofA. This method is useful for reducing periodic trends in data when outliers are present."gaussian"— Gaussian-weighted average over each window ofA."lowess"— Linear regression over each window ofA. This method can be computationally expensive, but results in fewer discontinuities."loess"— Quadratic regression over each window ofA. This method is slightly more computationally expensive than"lowess"."rlowess"— Robust linear regression over each window ofA. This method is a more computationally expensive version of the method"lowess", but it is more robust to outliers."rloess"— Robust quadratic regression over each window ofA. This method is a more computationally expensive version of the method"loess", but it is more robust to outliers."sgolay"— Savitzky-Golay filter, which smooths according to a quadratic polynomial that is fitted over each window ofA. This method can be more effective than other methods when the data varies rapidly.
Window size, specified as a positive integer or
duration scalar or two-element vector of nonnegative
integer or duration values.
smoothdata defines the window relative to the
sample points.
When
windowis a positive integer scalar, then the window has lengthwindowand is centered about the current element.When
windowis a two-element vector of nonnegative integers[b f], the window contains the current element,bpreceding elements, andfsucceeding elements.
When A is a timetable or
SamplePoints contains datetime or
duration values, window must be of
type duration.
For more information about the window position, see Moving Window Size.
Example: smoothdata(A,"movmean",4)
Example: smoothdata(A,"movmedian",[2 3])
Missing value condition, specified as one of these values:
"omitmissing"or"omitnan"— IgnoreNaNvalues inAwhen smoothing. If all elements in the window areNaN, then the corresponding elements inBareNaN."omitmissing"and"omitnan"have the same behavior."includemissing"or"includenan"— IncludeNaNvalues inAwhen smoothing. If any element in the window isNaN, then the corresponding elements inBareNaN."includemissing"and"includenan"have the same behavior.
Name-Value Arguments
Output Arguments
More About
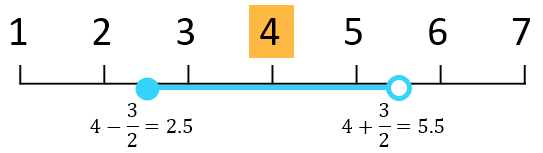
This table illustrates the window position across the default
uniformly spaced sample points vector [1 2 3 4 5 6 7].
Description | Window Size and Location | Sample Points in Window | Diagram |
|---|---|---|---|
For a scalar window size, the leading edge of the window is included and the trailing edge of the window is excluded. |
Current sample point = 4 | 3, 4, 5 |
|
Current sample point = 4 | 2, 3, 4, 5 |
| |
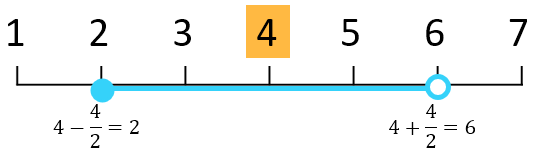
For a vector window size, the leading edge and the trailing edge are included. |
Current sample point = 4 | 2, 3, 4, 5, 6 |
|
For sample points near the endpoints of the input data, these moving statistic smoothing methods truncate the window so it begins at the first sample point or ends at the last sample point.
|
Current sample point = 2 | 1, 2, 3, 4 |
|
For sample points near the endpoints of the input data, these local regression smoothing methods shift the window to include the first or last sample point.
|
Current sample point = 2 | 1, 2, 3, 4, 5 |
|
![Given elements 1 to 7, if the current sample point is 4, then the corresponding window spans the range [2, 6].](movwindow_vector.png)
![Given elements 1 to 7, if the current sample point is 2, then the corresponding window spans the range [1, 4].](movwindow_edgetruncate.png)
![Given elements 1 to 7, if the current sample point is 2, then the corresponding window spans the range [1, 5].](movwindow_edgeslide.png)
Algorithms
When the window size for the smoothing method is not specified, smoothdata computes
a default window size based on a heuristic. For a smoothing factor τ,
the heuristic estimates a moving average window size that attenuates
approximately 100*τ percent of the energy of the input data.
Extended Capabilities
Version History
Introduced in R2017aSee Also
Functions
smoothdata2|fillmissing|fillmissing2|movmean|movmedian|movmad|filter