uniquetol
Unique values within tolerance
Syntax
Description
C = uniquetol(A,tol)A using tolerance tol.
Two values, u and v, are within
tolerance if
abs(u-v) <= tol*max(abs(A(:)))
That is, uniquetol scales tol input based on the
magnitude of the data.
uniquetol is similar to unique.
unique performs exact comparisons, while
uniquetol performs comparisons using a
tolerance.
C = uniquetol(A,___,occurrence)occurrence for either of the previous syntaxes.
[___] = uniquetol(___,
specifies additional parameters for determining the unique elements using one or
more name-value arguments. For example,
Name=Value)uniquetol(A,ByRows=true) determines the unique rows in
A.
Examples
Create a vector x. Obtain a second vector y by transforming and untransforming x. This transformation introduces round-off differences in y.
x = (1:6)'*pi;
y = 10.^log10(x);
Verify that x and y are not identical by taking the difference.
x-y
ans = 6×1
10-14 ×

    0.0444
         0
         0
         0
         0
   -0.3553
Concatenate the vectors x and y. Then, use unique to find the unique elements. The unique function performs exact comparisons and determines that some values in x are not exactly equal to values in y. These are the same elements that have a nonzero difference in x-y. Thus, C contains values that appear to be duplicates.
A = [x; y];
C = unique(A)
C = 8×1

    3.1416
    3.1416
    6.2832
    9.4248
   12.5664
   15.7080
   18.8496
   18.8496
Use uniquetol to perform the comparison using a small tolerance. uniquetol treats elements that are within tolerance as equal.
Ctol = uniquetol(A)
Ctol = 6×1

    3.1416
    6.2832
    9.4248
   12.5664
   15.7080
   18.8496
By default, uniquetol looks for unique elements that are within tolerance, but it also can find unique rows of a matrix that are within tolerance.
Create a numeric matrix, x. Obtain a second matrix, y, by transforming and untransforming x. This transformation introduces round-off differences to y.
x = [0.05 0.11 0.18; 0.18 0.21 0.29; 0.34 0.36 0.41; 0.46 0.52 0.76];
y = log10(10.^x);
Concatenate the matrices x and y. Then, use unique to find the unique rows. The unique function performs exact comparisons and determines that all of the rows in the concatenated matrix [x; y] are unique, even though some of the rows differ by only a small amount.
A = [x; y];
C = unique(A,"rows")
C = 8×3
0.0500 0.1100 0.1800
0.0500 0.1100 0.1800
0.1800 0.2100 0.2900
0.1800 0.2100 0.2900
0.3400 0.3600 0.4100
0.3400 0.3600 0.4100
0.4600 0.5200 0.7600
0.4600 0.5200 0.7600
Use uniquetol to find the unique rows. uniquetol treats rows that are within tolerance as equal.
Ctol = uniquetol(A,ByRows=true)
Ctol = 4×3

    0.0500    0.1100    0.1800
    0.1800    0.2100    0.2900
    0.3400    0.3600    0.4100
    0.4600    0.5200    0.7600
Create a vector, x. Obtain a second vector, y, by transforming and untransforming x. This transformation introduces round-off differences to some elements in y.
x = (1:5)'*pi;
y = 10.^log10(x);
Concatenate the vectors x and y. Then, use uniquetol to reconstruct A, treating the values that are within tolerance as equal.
A = [x; y];
[C,IA,IC] = uniquetol(A);
newA = C(IC)
newA = 10×1

    3.1416
    6.2832
    9.4248
   12.5664
   15.7080
    3.1416
    6.2832
    9.4248
   12.5664
   15.7080
You can use newA with == or functions that use exact equality like isequal or unique in subsequent code.
D1 = unique(A)
D1 = 6×1

    3.1416
    3.1416
    6.2832
    9.4248
   12.5664
   15.7080
D2 = unique(newA)
D2 = 5×1

    3.1416
    6.2832
    9.4248
   12.5664
   15.7080
Control which elements uniquetol selects as being unique by specifying the occurrence option.
Create a vector and find which elements are unique within a tolerance of 1e-1.
A = [1 1.1 1.11 1.12 1.13 2];
C = uniquetol(A,1e-1)
C = 1×2

     1     2
Since the first five elements in A all have similar values with respect to the tolerance of 1e-1, only the lowest value among them is selected as being unique. This is because uniquetol begins with the lowest value in a and does not find a new element that is not within tolerance until the 2 at the end of the vector.
Use the "highest" option to specify that uniquetol should begin with the highest value in A. Now, the 1.13 element is selected as being unique since uniquetol works down from the highest values.
C2 = uniquetol(A,1e-1,"highest")C2 = 1×2
1.1300 2.0000
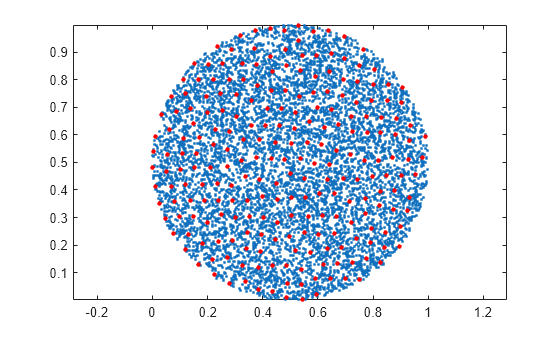
Create a cloud of 2-D sample points constrained to be inside a circle of radius 0.5 centered at the point .
x = rand(10000,2);
insideCircle = sqrt((x(:,1)-.5).^2+(x(:,2)-.5).^2)<0.5;
A = x(insideCircle,:);
Find a reduced set of points, such that each point of the original dataset is within tolerance of a point.
tol = 0.05;
C = uniquetol(A,tol,ByRows=true);
Plot the original data set and the reduced set of points. All of the points in the reduced set are members of the original data set and are at least a distance tol apart.
plot(A(:,1),A(:,2),"c.")
hold on
axis equal
plot(C(:,1),C(:,2),"r.",MarkerSize=10)
legend("Original Data","Reduced Data")
Create a vector of random numbers and determine the unique elements using a tolerance. Specify OutputAllIndices as true to return all of the indices for the elements that are within tolerance of the unique values.
rng default
A = rand(100,1);
[C,IA] = uniquetol(A,1e-2,OutputAllIndices=true);
Find the average value of the elements that are within tolerance of the value C(2).
C(2)
ans =
0.0318
allA = A(IA{2})allA = 3×1
0.0357
0.0318
0.0344
aveA = mean(allA)
aveA =
0.0340
By default, uniquetol uses a tolerance test of the form abs(u-v) <= tol*DS, where DS automatically scales based on the magnitude of the input data. You can specify a different DS value to use with the DataScale name-value argument. However, absolute tolerances (where DS is a scalar) do not scale based on the magnitude of the input data.
First, compare two small values that are a distance eps apart. Specify tol and DS to make the within tolerance equation: abs(u-v) <= 10^-6.
x = 0.1;
uniquetol([x exp(log(x))],10^-6,DataScale=1)
ans =
0.1000
Next, increase the magnitude of the values. The round-off error in the calculation exp(log(x)) is proportional to the magnitude of the values, specifically to eps(x). Even though the two large values are a distance eps from one another, eps(x) is now much larger. Therefore, 10^-6 is no longer a suitable tolerance.
x = 10^10;
uniquetol([x exp(log(x))],10^-6,DataScale=1)
ans = 1×2
1010 ×

    1.0000    1.0000
Correct this issue by using the default (scaled) value of DS.
format long
Y = [0.1 10^10];
uniquetol([Y exp(log(Y))])
ans = 1×2
1010 ×
0.000000000010000 1.000000000000000
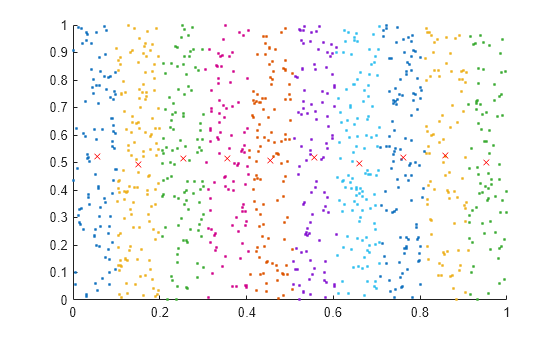
Create a set of random 2-D points, then use uniquetol to group the points into vertical bands that have a similar (within tolerance) x-coordinate. Use these options with uniquetol:
Specify
ByRowsastruesince the point coordinates are in the rows ofA.Specify
OutputAllIndicesastrueto return the indices for all points that have an x-coordinate within tolerance of each other.Specify
DataScaleas[1 Inf]to use an absolute tolerance for thex-coordinate while ignoring they-coordinate.
A = rand(1000,2);
DS = [1 Inf];
[C,IA] = uniquetol(A,0.1,ByRows=true,OutputAllIndices=true,DataScale=DS);
Plot the points and average value for each band.
hold on
for k = 1:length(IA)
    plot(A(IA{k},1),A(IA{k},2),".")
    meanAi = mean(A(IA{k},:));
    plot(meanAi(1),meanAi(2),"xr")
end
Input Arguments
Name-Value Arguments
Output Arguments
Algorithms
uniquetol sorts the input lexicographically, and then starts at
the lowest or highest value to find unique values within tolerance. As a result,
changing the sorting of the input could change the output. For example,
uniquetol(-A) might not give the same results as
-uniquetol(A).
There can be multiple valid C outputs that satisfy the condition,
no two elements in C are within tolerance of each
other. The uniquetol function can return several of
the valid outputs, depending on whether the value of occurrence is
"highest" or "lowest" and whether
PreserveRange is specified.
Extended Capabilities
Version History
Introduced in R2015aSee Also
unique | isapprox | ismembertol | ismember | eps