xlabel
Label x-axis
Description
xlabel( labels the x-axis
of the current axes or standalone visualization. Reissuing the
txt)xlabel command replaces the old label with the new
label.
xlabel(___, modifies
the label appearance using one or more name-value pair arguments.
For example, Name,Value)'FontSize',12 sets the font size to
12 points. Specify name-value pair arguments after all other input
arguments. Modifying the label appearance is not supported for all
types of charts.
Examples
Display Population beneath the x-axis.
plot((1:10).^2)
xlabel('Population')
Create a multiline label using a cell array of character vectors.
plot((1:10).^2)
xlabel({'Population','(in thousands)'})
Include Greek letters and other special characters in the label using TeX markup.
x = linspace(-2*pi,2*pi);
y = sin(x);
plot(x,y)
xlabel('-2\pi \leq x \leq 2\pi')
Add a label with text and a variable value. Use the num2str function to include a variable value in the label.
plot((1:10).^2)
year = 2014;
xlabel(['Population for Year ',num2str(year)])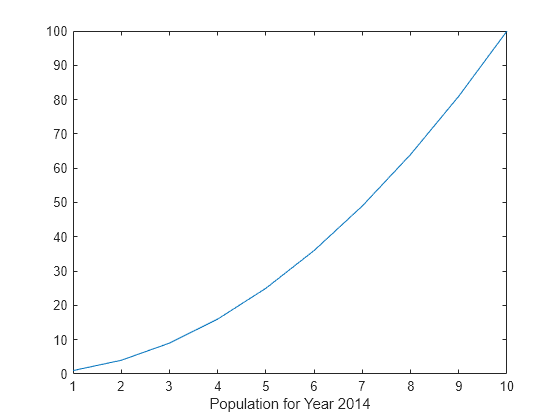
Use the '^' and '_' characters to include superscripts and subscripts in the axis labels. Use curly braces {} to modify more than one character.
t = linspace(0,1);
y = exp(t);
plot(t,y)
xlabel('t_{seconds}')
ylabel('e^t')

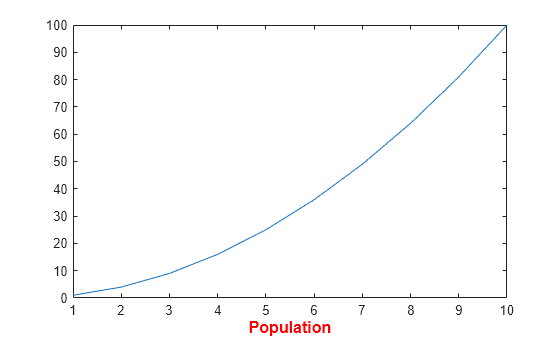
Use Name,Value pair arguments to set the font size, font weight, and text color properties of the x-axis label.
plot((1:10).^2)
xlabel('Population','FontSize',12,'FontWeight','bold','Color','r')
Starting in R2019b, you can display a tiling of plots using the tiledlayout and nexttile functions. Call the tiledlayout function to create a 2-by-1 tiled chart layout. Call the nexttile function to create the axes objects ax1 and ax2. Plot data into each axes, and create an x-axis label for the top plot.
tiledlayout(2,1)
ax1 = nexttile;
plot((1:10).^2)
xlabel(ax1,'Population')

ax2 = nexttile;
plot((1:10).^3)
Label the x-axis and return the text object used as the label.
plot((1:10).^2)
t = xlabel('Population');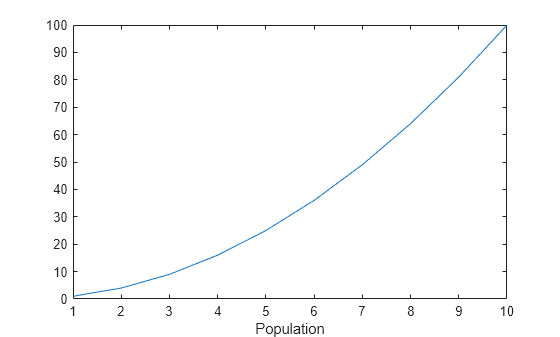
Use t to set text properties of the label after it has been created. For example, set the color of the label to red. Use dot notation to set properties.
t.Color = 'red';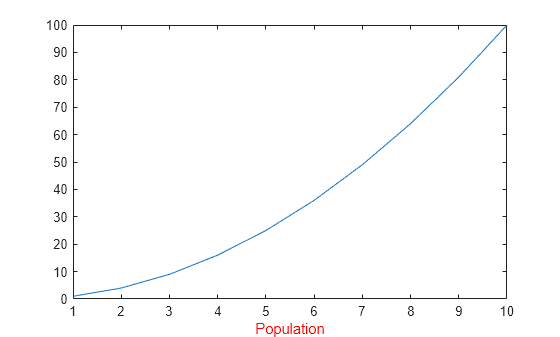
Input Arguments
Name-Value Arguments
Specify optional pairs of arguments as
Name1=Value1,...,NameN=ValueN, where Name is
the argument name and Value is the corresponding value.
Name-value arguments must appear after other arguments, but the order of the
pairs does not matter.
Example: xlabel("My Label",Color="red",FontSize=12) creates an
x-axis label with red text and a 12-point
font.
Before R2021a, use commas to separate each name and value, and enclose
Name in quotes.
Example: xlabel("My Label","Color","red","FontSize",12) creates
an x-axis label with red text and a 12-point font.
Note
The text properties listed here are only a subset. For a complete list, see Text Properties.
Font size, specified as a scalar value greater than 0 in
point units. One point equals 1/72 inch. To change the font units,
use the FontUnits property.
Setting the font size properties for the associated axes also
affects the label font size. The label font size updates to equal
the axes font size times the label scale factor. The FontSize property
of the axes contains the axes font size. The LabelFontSizeMultiplier property
of the axes contains the label scale factor. By default, the axes
font size is 10 points and the scale factor is 1.1, so the x-axis
label font size is 11 points.
Data Types: single | double | int8 | int16 | int32 | int64 | uint8 | uint16 | uint32 | uint64
Text color, specified as an RGB triplet, a hexadecimal color code, a color name, or a short name.
For a custom color, specify an RGB triplet or a hexadecimal color code.
An RGB triplet is a three-element row vector whose elements specify the intensities of the red, green, and blue components of the color. The intensities must be in the range
[0,1], for example,[0.4 0.6 0.7].A hexadecimal color code is a string scalar or character vector that starts with a hash symbol (
#) followed by three or six hexadecimal digits, which can range from0toF. The values are not case sensitive. Therefore, the color codes"#FF8800","#ff8800","#F80", and"#f80"are equivalent.
Alternatively, you can specify some common colors by name. This table lists the named color options, the equivalent RGB triplets, and the hexadecimal color codes.
| Color Name | Short Name | RGB Triplet | Hexadecimal Color Code | Appearance |
|---|---|---|---|---|
"red" | "r" | [1 0 0] | "#FF0000" |
|
"green" | "g" | [0 1 0] | "#00FF00" |
|
"blue" | "b" | [0 0 1] | "#0000FF" |
|
"cyan"
| "c" | [0 1 1] | "#00FFFF" |
|
"magenta" | "m" | [1 0 1] | "#FF00FF" |
|
"yellow" | "y" | [1 1 0] | "#FFFF00" |
|
"black" | "k" | [0 0 0] | "#000000" |
|
"white" | "w" | [1 1 1] | "#FFFFFF" |
|
"none" | Not applicable | Not applicable | Not applicable | No color |
This table lists the default color palettes for plots in the light and dark themes.
| Palette | Palette Colors |
|---|---|
Before R2025a: Most plots use these colors by default. |
|
|
|
You can get the RGB triplets and hexadecimal color codes for these palettes using the orderedcolors and rgb2hex functions. For example, get the RGB triplets for the "gem" palette and convert them to hexadecimal color codes.
RGB = orderedcolors("gem");
H = rgb2hex(RGB);
Before R2023b: Get the RGB triplets using RGB =
get(groot,"FactoryAxesColorOrder").
Before R2024a: Get the hexadecimal color codes using H =
compose("#%02X%02X%02X",round(RGB*255)).
Example: 'blue'
Example: [0 0 1]
Example: '#0000FF'
Text orientation, specified as a scalar value in degrees. A rotation value of 0 degrees makes the text horizontal. For vertical text, set this property to 90 or -90. Positive values rotate the text counterclockwise. Negative values rotate the text clockwise.
Data Types: single | double | int8 | int16 | int32 | int64 | uint8 | uint16 | uint32 | uint64
Text interpreter, specified as one of these values:
'tex'— Interpret characters using a subset of TeX markup.'latex'— Interpret characters using LaTeX markup.'none'— Display literal characters.
TeX Markup
By default, MATLAB supports a subset of TeX markup. Use TeX markup to add superscripts and subscripts, modify the font type and color, and include special characters in the text.
Modifiers remain in effect until the end of the text.
Superscripts and subscripts are an exception because they modify only the next character or the
characters within the curly braces. When you set the interpreter to "tex",
the supported modifiers are as follows.
| Modifier | Description | Example |
|---|---|---|
^{ } | Superscript | "text^{superscript}" |
_{ } | Subscript | "text_{subscript}" |
\bf | Bold font | "\bf text" |
\it | Italic font | "\it text" |
\sl | Oblique font (usually the same as italic font) | "\sl text" |
\rm | Normal font | "\rm text" |
\fontname{ | Font name — Replace
| "\fontname{Courier} text" |
\fontsize{ | Font size —Replace
| "\fontsize{15} text" |
\color{ | Font color — Replace
red, green,
yellow, magenta,
blue, black,
white, gray,
darkGreen, orange, or
lightBlue. | "\color{magenta} text" |
\color[rgb]{specifier} | Custom font color — Replace
| "\color[rgb]{0,0.5,0.5} text" |
This table lists the supported special characters for the
"tex" interpreter.
| Character Sequence | Symbol | Character Sequence | Symbol | Character Sequence | Symbol |
|---|---|---|---|---|---|
| α |
| υ |
| ~ |
| ∠ |
| ϕ |
| ≤ |
|
|
| χ |
| ∞ |
| β |
| ψ |
| ♣ |
| γ |
| ω |
| ♦ |
| δ |
| Γ |
| ♥ |
| ϵ |
| Δ |
| ♠ |
| ζ |
| Θ |
| ↔ |
| η |
| Λ |
| ← |
| θ |
| Ξ |
| ⇐ |
| ϑ |
| Π |
| ↑ |
| ι |
| Σ |
| → |
| κ |
| ϒ |
| ⇒ |
| λ |
| Φ |
| ↓ |
| µ |
| Ψ |
| º |
| ν |
| Ω |
| ± |
| ξ |
| ∀ |
| ≥ |
| π |
| ∃ |
| ∝ |
| ρ |
| ∍ |
| ∂ |
| σ |
| ≅ |
| • |
| ς |
| ≈ |
| ÷ |
| τ |
| ℜ |
| ≠ |
| ≡ |
| ⊕ |
| ℵ |
| ℑ |
| ∪ |
| ℘ |
| ⊗ |
| ⊆ |
| ∅ |
| ∩ |
| ∈ |
| ⊇ |
| ⊃ |
| ⌈ |
| ⊂ |
| ∫ |
| · |
| ο |
| ⌋ |
| ¬ |
| ∇ |
| ⌊ |
| x |
| ... |
| ⊥ |
| √ |
| ´ |
| ∧ |
| ϖ |
| ∅ |
| ⌉ |
| 〉 |
| | |
| ∨ |
| 〈 |
| © |
LaTeX Markup
To use LaTeX markup, set the interpreter to "latex". For inline
mode, surround the markup with single dollar signs ($). For
display mode, surround the markup with double dollar signs
($$).
| LaTeX Mode | Example | Result |
|---|---|---|
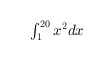
| Inline |
"$\int_1^{20} x^2 dx$" |
|
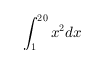
| Display |
"$$\int_1^{20} x^2 dx$$" |
|
The displayed text uses the default LaTeX font style. The
FontName, FontWeight, and
FontAngle properties do not have an effect. To change the
font style, use LaTeX markup.
The maximum size of the text that you can use with the LaTeX interpreter is 1200 characters. For multiline text, this reduces by about 10 characters per line.
MATLAB supports most standard LaTeX math mode commands. For more information, see Supported LaTeX Commands. For examples that use TeX and LaTeX, see Greek Letters and Special Characters in Chart Text.
Output Arguments
Tips
By default, the
Interactionsproperty containseditInteractionso the text can be edited by clicking on the text. To disable this interaction, set theInteractionsproperty of the text object to[].