lsqcurvefit
Solve nonlinear curve-fitting (data-fitting) problems in least-squares sense
Syntax
Description
Nonlinear least-squares solver
Find coefficients x that solve the problem
given input data xdata, and the observed output ydata, where xdata and ydata are matrices or vectors, and F (x, xdata) is a matrix-valued or vector-valued function of the same size as ydata.
Optionally, the components of x are subject to the constraints
The arguments x, lb, and ub can be vectors or matrices; see Matrix Arguments.
The lsqcurvefit function uses the same
algorithm as lsqnonlin. lsqcurvefit simply
provides a convenient interface for data-fitting problems.
Rather than compute the sum of squares, lsqcurvefit requires
the user-defined function to compute the vector-valued
function
x = lsqcurvefit(fun,x0,xdata,ydata)x0 and finds coefficients x to
best fit the nonlinear function fun(x,xdata) to
the data ydata (in the least-squares sense). ydata must
be the same size as the vector (or matrix) F returned
by fun.
Note
Passing Extra Parameters explains
how to pass extra parameters to the vector function fun(x),
if necessary.
x = lsqcurvefit(fun,x0,xdata,ydata,lb,ub)x,
so that the solution is always in the range lb ≤ x ≤ ub.
You can fix the solution component x(i) by specifying lb(i) = ub(i).
Note
If the specified input bounds for a problem are inconsistent,
the output x is x0 and the outputs resnorm and residual are [].
Components of x0 that violate the bounds lb ≤ x ≤ ub are reset to the interior of the box defined
by the bounds. Components that respect the bounds are not changed.
x = lsqcurvefit(fun,x0,xdata,ydata,lb,ub,options)x = lsqcurvefit(fun,x0,xdata,ydata,lb,ub,A,b,Aeq,beq,nonlcon,options)options. Use
optimoptions to set these options. Pass
empty matrices for lb and ub and for other input
arguments if the arguments do not exist.
Examples
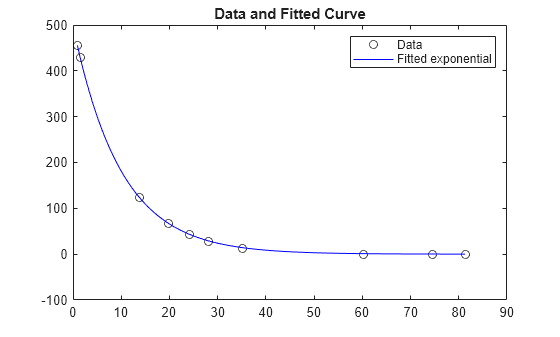
Suppose that you have observation time data xdata and observed response data ydata, and you want to find parameters and to fit a model of the form
Input the observation times and responses.
xdata = ...
 [0.9 1.5 13.8 19.8 24.1 28.2 35.2 60.3 74.6 81.3];
ydata = ...
 [455.2 428.6 124.1 67.3 43.2 28.1 13.1 -0.4 -1.3 -1.5];
Create a simple exponential decay model.
fun = @(x,xdata)x(1)*exp(x(2)*xdata);
Fit the model using the starting point x0 = [100,-1].
x0 = [100,-1];
x = lsqcurvefit(fun,x0,xdata,ydata)
Local minimum possible.

lsqcurvefit stopped because the final change in the sum of squares relative to
its initial value is less than the value of the function tolerance.

<stopping criteria details>
x = 1×2

  498.8309   -0.1013
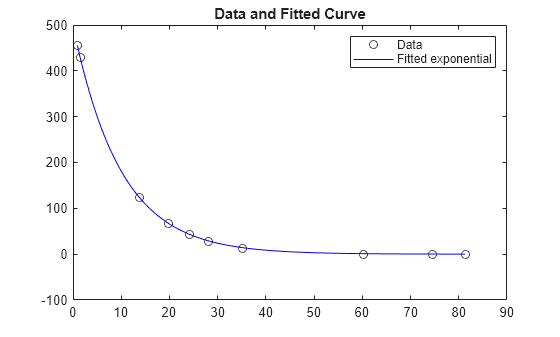
Plot the data and the fitted curve.
times = linspace(xdata(1),xdata(end));
plot(xdata,ydata,"ko",times,fun(x,times),"b-")
legend("Data","Fitted exponential")
title("Data and Fitted Curve")
Find the best exponential fit to data where the fitting parameters are constrained.
Generate data from an exponential decay model plus noise. The model is
with ranging from 0 through 3, and normally distributed noise with mean 0 and standard deviation 0.05.
rng default % for reproducibility
xdata = linspace(0,3);
ydata = exp(-1.3*xdata) + 0.05*randn(size(xdata));
The problem is: given the data (xdata, ydata), find the exponential decay model that best fits the data, with the parameters bounded as follows:
lb = [0,-2];
ub = [3/4,-1];
Create the model.
fun = @(x,xdata)x(1)*exp(x(2)*xdata);
Create an initial guess.
x0 = [1/2,-2];
Solve the bounded fitting problem.
x = lsqcurvefit(fun,x0,xdata,ydata,lb,ub)
Local minimum found.

Optimization completed because the size of the gradient is less than
the value of the optimality tolerance.

<stopping criteria details>
x = 1×2

    0.7500   -1.0000
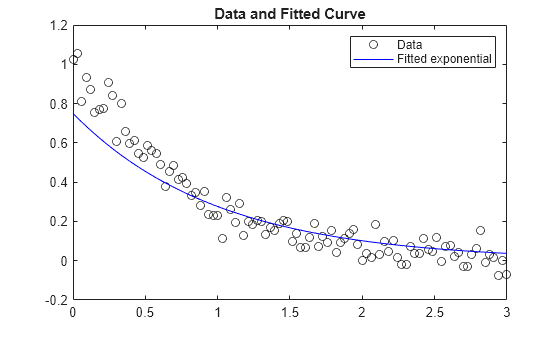
Examine how well the resulting curve fits the data. Because the bounds keep the solution away from the true values, the fit is mediocre.
plot(xdata,ydata,"ko",xdata,fun(x,xdata),"b-")
legend("Data","Fitted exponential")
title("Data and Fitted Curve")
Create artificial data for a nonlinear model with parameters , , , and , for time from 2 to 7. Add noise to the data using randn.
a = 2; % x(1)
b = 4; % x(2)
t0 = 5; % x(3)
c = 1/2; % x(4)
xdata = linspace(2,7);
rng default
ydata = a + b*atan(xdata - t0) + c*xdata + 1/10*randn(size(xdata));
Plot the data.
plot(xdata,ydata,"ro")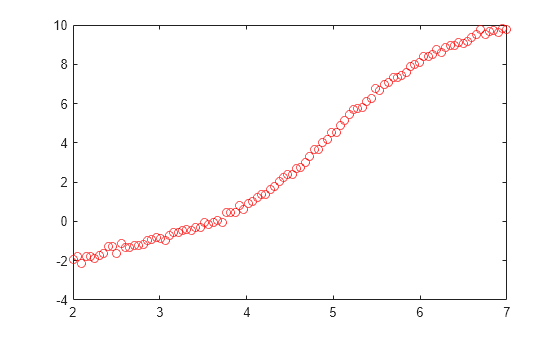
Fit a nonlinear model to the data with the following constraints:
All coefficients are between 0 and 7.
. You can write this constraint in the form
A*x <= busingA = [-1 -1 1 1]andb = 0.
lb = zeros(4,1);
ub = 7*ones(4,1);
A = [-1 -1 1 1];
b = 0;
The myfun function at the end of this example creates the objective function for this model.
Solve the fitting problem starting from the point [1 2 3 1].
startpt = [1 2 3 1];
Aeq = [];
beq = [];
[x,res] = lsqcurvefit(@myfun,startpt,xdata,ydata,lb,ub,A,b,Aeq,beq)
Local minimum found that satisfies the constraints.

Optimization completed because the objective function is non-decreasing in
feasible directions, to within the value of the optimality tolerance,
and constraints are satisfied to within the value of the constraint tolerance.

<stopping criteria details>
x = 1×4

    2.3447    4.0972    4.9979    0.4303
res =
1.2682
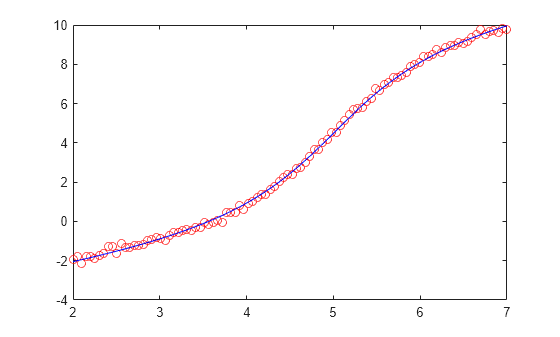
The returned solution is not far from the original point [2 4 5 1/2]. Plot the data against the curve from the solution point.
plot(xdata,ydata,"ro",xdata,myfun(x,xdata),"b-")
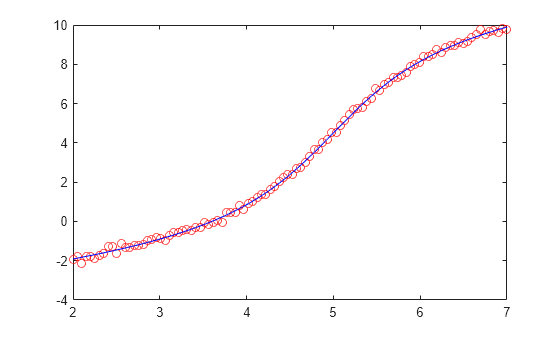
The returned solution matches the data pretty well. Is the constraint active?
A*x(:)
ans =
-1.0137
The constraint is not active, because A*x < 0.
function F = myfun(x,xdata)
a = x(1);
b = x(2);
t0 = x(3);
c = x(4);
F = a + b*atan(xdata - t0) + c*xdata;
end
Create artificial data for a nonlinear model with parameters , , , and , for time from 2 to 7. Add noise to the data using randn.
a = 2; % x(1)
b = 4; % x(2)
t0 = 5; % x(3)
c = 1/2; % x(4)
xdata = linspace(2,7);
rng default
ydata = a + b*atan(xdata - t0) + c*xdata + 1/10*randn(size(xdata));
Plot the data.
plot(xdata,ydata,"ro")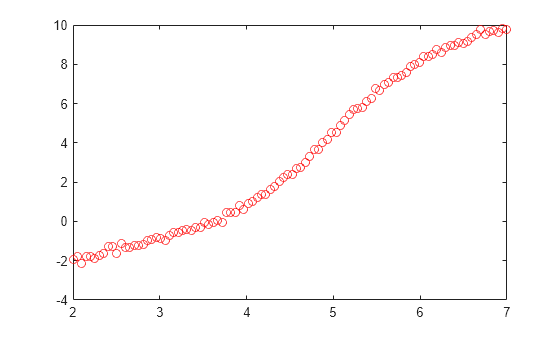
Fit a nonlinear model to the data with the following constraints:
All coefficients are between 0 and 7.
lb = zeros(4,1);
ub = 7*ones(4,1);
The problem has no linear constraints.
A = [];
b = [];
Aeq = [];
beq = [];
The myfun function at the end of this example creates the objective function for this model. The nlcon function at the end of this example creates the nonlinear constraint function.
Solve the fitting problem starting from the point [1 2 3 1].
startpt = [1 2 3 1];
[x,res] = lsqcurvefit(@myfun,startpt,xdata,ydata,lb,ub,A,b,Aeq,beq,@nlcon)
Feasible point with lower objective function value found, but optimality criteria not satisfied. See output.bestfeasible..


Local minimum found that satisfies the constraints.

Optimization completed because the objective function is non-decreasing in
feasible directions, to within the value of the optimality tolerance,
and constraints are satisfied to within the value of the constraint tolerance.

<stopping criteria details>
x = 1×4

    1.3806    3.7542    5.0169    0.6337
res =
1.6018
The returned solution x is not at the original point [2 4 5 1/2] because the nonlinear constraint is violated at that point. Plot the data against the curve from the solution point and compute the constraint function.
plot(xdata,ydata,"ro",xdata,myfun(x,xdata),"b-")
[ineqnonlin,eqnonlin] = nlcon(x)
ineqnonlin =
-3.1307e-06
eqnonlin =

     []
The nonlinear inequality constraint is active at the solution because ineqnonlin = 0 at the solution.
Even though the solution point is not at the original point, the solution curve matches the data pretty well.
function F = myfun(x,xdata)
a = x(1);
b = x(2);
t0 = x(3);
c = x(4);
F = a + b*atan(xdata - t0) + c*xdata;
end

function [ineqnonlin,eqnonlin] = nlcon(x)
eqnonlin = [];
ineqnonlin = x(1)^2 + x(2)^2 - 4^2;
end
Compare the results of fitting with the default "trust-region-reflective" algorithm and the "levenberg-marquardt" algorithm.
Suppose that you have observation time data xdata and observed response data ydata, and you want to find parameters and to fit a model of the form
Input the observation times and responses.
xdata = ...
 [0.9 1.5 13.8 19.8 24.1 28.2 35.2 60.3 74.6 81.3];
ydata = ...
 [455.2 428.6 124.1 67.3 43.2 28.1 13.1 -0.4 -1.3 -1.5];
Create a simple exponential decay model.
fun = @(x,xdata)x(1)*exp(x(2)*xdata);
Fit the model using the starting point x0 = [100,-1].
x0 = [100,-1];
x = lsqcurvefit(fun,x0,xdata,ydata)
Local minimum possible.

lsqcurvefit stopped because the final change in the sum of squares relative to
its initial value is less than the value of the function tolerance.

<stopping criteria details>
x = 1×2

  498.8309   -0.1013
Compare the solution with that of a "levenberg-marquardt" fit.
options = optimoptions("lsqcurvefit",Algorithm="levenberg-marquardt");
lb = [];
ub = [];
x = lsqcurvefit(fun,x0,xdata,ydata,lb,ub,options)
Local minimum possible.
lsqcurvefit stopped because the relative size of the current step is less than
the value of the step size tolerance.

<stopping criteria details>
x = 1×2

  498.8309   -0.1013
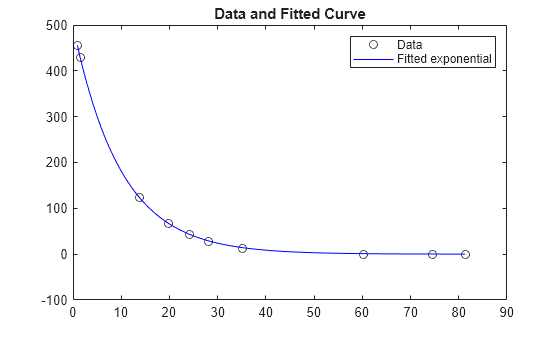
The two algorithms converged to the same solution. Plot the data and the fitted exponential model.
times = linspace(xdata(1),xdata(end));
plot(xdata,ydata,"ko",times,fun(x,times),"b-")
legend("Data","Fitted exponential")
title("Data and Fitted Curve")
Compare the results of fitting with the default "trust-region-reflective" algorithm and the "levenberg-marquardt" algorithm. Examine the solution process to see which is more efficient in this case.
Suppose that you have observation time data xdata and observed response data ydata, and you want to find parameters and to fit a model of the form
Input the observation times and responses.
xdata = ...
 [0.9 1.5 13.8 19.8 24.1 28.2 35.2 60.3 74.6 81.3];
ydata = ...
 [455.2 428.6 124.1 67.3 43.2 28.1 13.1 -0.4 -1.3 -1.5];
Create a simple exponential decay model.
fun = @(x,xdata)x(1)*exp(x(2)*xdata);
Fit the model using the starting point x0 = [100,-1].
x0 = [100,-1];
[x,resnorm,residual,exitflag,output] = lsqcurvefit(fun,x0,xdata,ydata);
Local minimum possible.

lsqcurvefit stopped because the final change in the sum of squares relative to
its initial value is less than the value of the function tolerance.

<stopping criteria details>
Compare the solution with that of a "levenberg-marquardt" fit.
options = optimoptions("lsqcurvefit",Algorithm="levenberg-marquardt");
lb = [];
ub = [];
[x2,resnorm2,residual2,exitflag2,output2] = lsqcurvefit(fun,x0,xdata,ydata,lb,ub,options);
Local minimum possible.
lsqcurvefit stopped because the relative size of the current step is less than
the value of the step size tolerance.

<stopping criteria details>
Are the solutions equivalent?
norm(x-x2)
ans =
2.0642e-06
Yes, the solutions are equivalent.
Which algorithm took fewer function evaluations to arrive at the solution?
fprintf(['The ''trust-region-reflective'' algorithm took %d function evaluations,\n',...
   'and the ''levenberg-marquardt'' algorithm took %d function evaluations.\n'],...
   output.funcCount,output2.funcCount)
The 'trust-region-reflective' algorithm took 87 function evaluations,
and the 'levenberg-marquardt' algorithm took 72 function evaluations.
Plot the data and the fitted exponential model.
times = linspace(xdata(1),xdata(end));
plot(xdata,ydata,"ko",times,fun(x,times),"b-")
legend("Data","Fitted exponential")
title("Data and Fitted Curve")
The fit looks good. How large are the residuals?
fprintf(['The ''trust-region-reflective'' algorithm has residual norm %f,\n',...
   'and the ''levenberg-marquardt'' algorithm has residual norm %f.\n'],...
   resnorm,resnorm2)
The 'trust-region-reflective' algorithm has residual norm 9.504887,
and the 'levenberg-marquardt' algorithm has residual norm 9.504887.
Input Arguments
Output Arguments
Limitations
The trust-region-reflective algorithm does not solve underdetermined systems; it requires that the number of equations, i.e., the row dimension of F, be at least as great as the number of variables. In the underdetermined case,
lsqcurvefituses the Levenberg-Marquardt algorithm.lsqcurvefitcan solve complex-valued problems directly. Note that constraints do not make sense for complex values, because complex numbers are not well-ordered; asking whether one complex value is greater or less than another complex value is nonsensical. For a complex problem with bound constraints, split the variables into real and imaginary parts. Do not use the'interior-point'algorithm with complex data. See Fit a Model to Complex-Valued Data.The preconditioner computation used in the preconditioned conjugate gradient part of the trust-region-reflective method forms JTJ (where J is the Jacobian matrix) before computing the preconditioner. Therefore, a row of J with many nonzeros, which results in a nearly dense product JTJ, can lead to a costly solution process for large problems.
If components of x have no upper (or lower) bounds,
lsqcurvefitprefers that the corresponding components ofub(orlb) be set toinf(or-inffor lower bounds) as opposed to an arbitrary but very large positive (or negative for lower bounds) number.
You can use the trust-region reflective algorithm in lsqnonlin, lsqcurvefit,
and fsolve with small- to medium-scale
problems without computing the Jacobian in fun or
providing the Jacobian sparsity pattern. (This also applies to using fmincon or fminunc without
computing the Hessian or supplying the Hessian sparsity pattern.)
How small is small- to medium-scale? No absolute answer is available,
as it depends on the amount of virtual memory in your computer system
configuration.
Suppose your problem has m equations and n unknowns.
If the command J = sparse(ones(m,n)) causes
an Out of memory error on your machine,
then this is certainly too large a problem. If it does not result
in an error, the problem might still be too large. You can find out
only by running it and seeing if MATLAB runs within the amount
of virtual memory available on your system.
More About
A local minimum of a function is a point where the function value is smaller than at nearby points, but possibly greater than at a distant point.
A global minimum is a point where the function value is smaller than at all other feasible points.
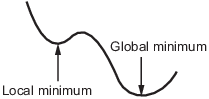
Solvers try to find a local minimum. The result can be a global minimum. For more information, see Local vs. Global Optima.
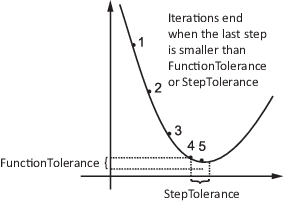
The function tolerance called
FunctionTolerance relates to the size of the latest change in
objective function value.
Algorithms
The Levenberg-Marquardt and trust-region-reflective methods
are based on the nonlinear least-squares algorithms also used in fsolve.
The default trust-region-reflective algorithm is a subspace trust-region method and is based on the interior-reflective Newton method described in [1] and [2]. Each iteration involves the approximate solution of a large linear system using the method of preconditioned conjugate gradients (PCG). See Trust-Region-Reflective Least Squares.
The Levenberg-Marquardt method is described in references [4], [5], and [6]. See Levenberg-Marquardt Method.
The 'interior-point' algorithm uses the fmincon
'interior-point' algorithm with some modifications. For details, see
Modified fmincon Algorithm for Constrained Least Squares.
Alternative Functionality
App
The Optimize Live Editor task provides a visual interface for lsqcurvefit.
References
[1] Coleman, T.F. and Y. Li. “An Interior, Trust Region Approach for Nonlinear Minimization Subject to Bounds.” SIAM Journal on Optimization, Vol. 6, 1996, pp. 418–445.
[2] Coleman, T.F. and Y. Li. “On the Convergence of Reflective Newton Methods for Large-Scale Nonlinear Minimization Subject to Bounds.” Mathematical Programming, Vol. 67, Number 2, 1994, pp. 189–224.
[3] Dennis, J. E. Jr. “Nonlinear Least-Squares.” State of the Art in Numerical Analysis, ed. D. Jacobs, Academic Press, pp. 269–312.
[4] Levenberg, K. “A Method for the Solution of Certain Problems in Least-Squares.” Quarterly Applied Mathematics 2, 1944, pp. 164–168.
[5] Marquardt, D. “An Algorithm for Least-squares Estimation of Nonlinear Parameters.” SIAM Journal Applied Mathematics, Vol. 11, 1963, pp. 431–441.
[6] Moré, J. J. “The Levenberg-Marquardt Algorithm: Implementation and Theory.” Numerical Analysis, ed. G. A. Watson, Lecture Notes in Mathematics 630, Springer Verlag, 1977, pp. 105–116.
[7] Moré, J. J., B. S. Garbow, and K. E. Hillstrom. User Guide for MINPACK 1. Argonne National Laboratory, Rept. ANL–80–74, 1980.
[8] Powell, M. J. D. “A Fortran Subroutine for Solving Systems of Nonlinear Algebraic Equations.” Numerical Methods for Nonlinear Algebraic Equations, P. Rabinowitz, ed., Ch.7, 1970.