Simulink.sdi.close
Close the Simulation Data Inspector
Description
Simulink.sdi.close closes the Simulation
Data Inspector.
Simulink.sdi.close( closes
the Simulation Data Inspector and saves the data in the file,
'filename')filename.
Examples
Close the Simulation Data Inspector from the Command Line
You can close the Simulation Data Inspector from the MATLAB® command line when you have finished inspecting and analyzing your data.
Simulink.sdi.close
Create Run and View Data
Create a run, add data to it, and then view the data in the Simulation Data Inspector.
Create Data for Run
Create timeseries objects to contain data for a sine signal and a cosine signal. Give each timeseries object a descriptive name.
time = linspace(0,20,100);

sine_vals = sin(2*pi/5*time);
sine_ts = timeseries(sine_vals,time);
sine_ts.Name = "Sine, T=5";

cos_vals = cos(2*pi/8*time);
cos_ts = timeseries(cos_vals,time);
cos_ts.Name = "Cosine, T=8";
Create Run and Add Data
Use the Simulink.sdi.view function to open the Simulation Data Inspector.
Simulink.sdi.view
To import data into the Simulation Data Inspector from the workspace, create a Simulink.sdi.Run object using the Simulink.sdi.Run.create function. Add information about the run to its metadata using the Name and Description properties of the Run object.
sinusoidsRun = Simulink.sdi.Run.create;
sinusoidsRun.Name = "Sinusoids";
sinusoidsRun.Description = "Sine and cosine signals with different frequencies";
Use the add function to add the data you created in the workspace to the empty run.
add(sinusoidsRun,"vars",sine_ts,cos_ts);Plot Data in Simulation Data Inspector
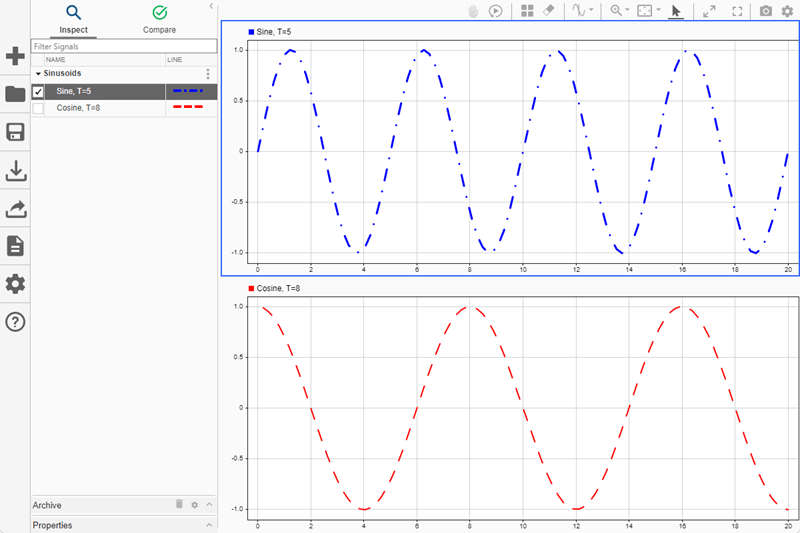
Use the getSignalByIndex function to access Simulink.sdi.Signal objects that contain the signal data. You can use the Simulink.sdi.Signal object properties to specify the line style and color for the signal and plot the signal in the Simulation Data Inspector. Specify the LineColor and LineDashed properties for each signal.
sine_sig = getSignalByIndex(sinusoidsRun,1);
sine_sig.LineColor = [0 0 1];
sine_sig.LineDashed = "-.";

cos_sig = sinusoidsRun.getSignalByIndex(2);
cos_sig.LineColor = [1 0 0];
cos_sig.LineDashed = "--";
Use the Simulink.sdi.setSubPlotLayout function to configure a 2-by-1 subplot layout in the Simulation Data Inspector plotting area. Then, use the plotOnSubplot function to plot the sine signal on the top subplot and the cosine signal on the lower subplot.
Simulink.sdi.setSubPlotLayout(2,1);

plotOnSubPlot(sine_sig,1,1,true);
plotOnSubPlot(cos_sig,2,1,true);
Close Simulation Data Inspector and Save Your Data
When you finish inspecting the plotted signal data, you can close the Simulation Data Inspector and save the session to an MLDATX file.
Simulink.sdi.close("sinusoids.mldatx")Version History
Introduced in R2013b
You can also select a web site from the following list:
Americas
- América Latina (Español)
- Canada (English)
- United States (English)
Europe
- Belgium (English)
- Denmark (English)
- Deutschland (Deutsch)
- España (Español)
- Finland (English)
- France (Français)
- Ireland (English)
- Italia (Italiano)
- Luxembourg (English)
- Netherlands (English)
- Norway (English)
- Österreich (Deutsch)
- Portugal (English)
- Sweden (English)
- Switzerland
- United Kingdom (English)