confusionmat
Compute confusion matrix for classification problem
Syntax
Description
Examples
Display the confusion matrix for data with two misclassifications and one missing classification.
Create vectors for the known groups and the predicted groups.
g1 = [3 2 2 3 1 1]';	% Known groups
g2 = [4 2 3 NaN 1 1]';	% Predicted groups
Return the confusion matrix.
C = confusionmat(g1,g2)
C = 4×4

     2     0     0     0
     0     1     1     0
     0     0     0     1
     0     0     0     0
The indices of the rows and columns of the confusion matrix C are identical and arranged by default in the sorted order of [g1;g2], that is, (1,2,3,4).
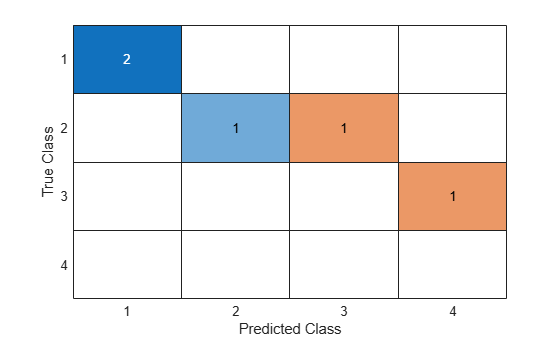
The confusion matrix shows that the two data points known to be in group 1 are classified correctly. For group 2, one of the data points is misclassified into group 3. Also, one of the data points known to be in group 3 is misclassified into group 4. confusionmat treats the NaN value in the grouping variable g2 as a missing value and does not include it in the rows and columns of C.
Plot the confusion matrix as a confusion matrix chart by using confusionchart.
confusionchart(C)
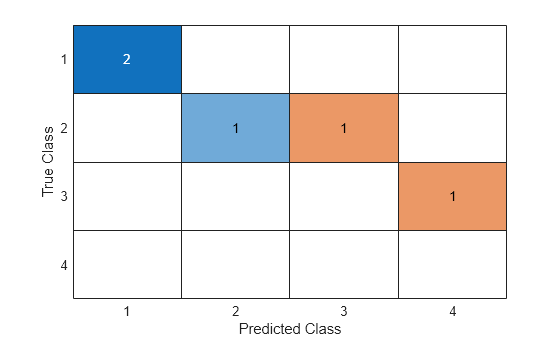
You do not need to calculate the confusion matrix first and then plot it. Instead, plot a confusion matrix chart directly from the true and predicted labels by using confusionchart.
cm = confusionchart(g1,g2)
cm =
  ConfusionMatrixChart with properties:

    NormalizedValues: [4×4 double]
         ClassLabels: [4×1 double]

  Show all properties
The ConfusionMatrixChart object stores the numeric confusion matrix in the NormalizedValues property and the classes in the ClassLabels property. Display these properties using dot notation.
cm.NormalizedValues
ans = 4×4

     2     0     0     0
     0     1     1     0
     0     0     0     1
     0     0     0     0
cm.ClassLabels
ans = 4×1

     1
     2
     3
     4
Display the confusion matrix for data with two misclassifications and one missing classification, and specify the group order.
Create vectors for the known groups and the predicted groups.
g1 = [3 2 2 3 1 1]';	% Known groups
g2 = [4 2 3 NaN 1 1]';	% Predicted groups
Specify the group order and return the confusion matrix.
C = confusionmat(g1,g2,'Order',[4 3 2 1])C = 4×4
0 0 0 0
1 0 0 0
0 1 1 0
0 0 0 2
The indices of the rows and columns of the confusion matrix C are identical and arranged in the order specified by the group order, that is, (4,3,2,1).
The second row of the confusion matrix C shows that one of the data points known to be in group 3 is misclassified into group 4. The third row of C shows that one of the data points belonging to group 2 is misclassified into group 3, and the fourth row shows that the two data points known to be in group 1 are classified correctly. confusionmat treats the NaN value in the grouping variable g2 as a missing value and does not include it in the rows and columns of C.
Find the number of misclassifications associated with classifying observations from one group into another. Use the group order to index into the confusion matrix.
Create vectors for the true and predicted origins of 10 cars.
trueOrigin = ["USA","USA","USA","USA","Germany", ...
    "Japan","USA","USA","USA","USA"];
predictedOrigin = ["USA","USA","Germany","Germany","Germany", ...
    "Japan","USA","USA","USA","USA"];
Return the confusion matrix and the order of the car origins. Then, convert the confusion matrix to a table with the correct row and column names. The row names correspond to the true origin groups, and the column names correspond to the predicted origin groups.
[C,order] = confusionmat(trueOrigin,predictedOrigin)
C = 3×3

     6     2     0
     0     1     0
     0     0     1
order = 3×1 string
    "USA"
    "Germany"
    "Japan"
T = array2table(C,RowNames=order,VariableNames=order)
T=3×3 table
               USA    Germany    Japan
               ___    _______    _____

    USA         6        2         0
    Germany     0        1         0
    Japan       0        0         1
In the confusion matrix C, find the number of cars from the United States that are misclassified as being from Germany.
idxUSA = strcmp(order,"USA");
idxGermany = strcmp(order,"Germany");

numC = C(idxUSA,idxGermany)
numC =
2
Two of the USA cars are incorrectly classified as Germany cars.
Alternatively, find the same value as numC in the table T.
numT = T{"USA","Germany"}numT = 2
Perform classification on a sample of the fisheriris data set and display the confusion matrix for the resulting classification.
Load Fisher's iris data set.
load fisheririsRandomize the measurements and groups in the data.
rng(0,'twister'); % For reproducibility
numObs = length(species);
p = randperm(numObs);
meas = meas(p,:);
species = species(p);
Train a discriminant analysis classifier by using measurements in the first half of the data.
half = floor(numObs/2);
training = meas(1:half,:);
trainingSpecies = species(1:half);
Mdl = fitcdiscr(training,trainingSpecies);
Predict labels for the measurements in the second half of the data by using the trained classifier.
sample = meas(half+1:end,:);
grouphat = predict(Mdl,sample);
Specify the group order and display the confusion matrix for the resulting classification.
group = species(half+1:end);
[C,order] = confusionmat(group,grouphat,'Order',{'setosa','versicolor','virginica'})
C = 3×3

    29     0     0
     0    22     2
     0     0    22
order = 3×1 cell
    {'setosa'    }
    {'versicolor'}
    {'virginica' }
The confusion matrix shows that the measurements belonging to setosa and virginica are classified correctly, while two of the measurements belonging to versicolor are misclassified as virginica. The output order contains the order of the rows and columns of the confusion matrix in the sequence specified by the group order {'setosa','versicolor','virginica'}.
Perform classification on a tall array of the fisheriris data set, compute a confusion matrix for the known and predicted tall labels by using the confusionmat function, and plot the confusion matrix by using the confusionchart function.
When you perform calculations on tall arrays, MATLAB® uses either a parallel pool (default if you have Parallel Computing Toolbox™) or the local MATLAB session. If you want to run the example using the local MATLAB session when you have Parallel Computing Toolbox, you can change the global execution environment by using the mapreducer function.
Load Fisher's iris data set.
load fisheririsConvert the in-memory arrays meas and species to tall arrays.
tx = tall(meas);
Starting parallel pool (parpool) using the 'local' profile ...
Connected to the parallel pool (number of workers: 6).
ty = tall(species);
Find the number of observations in the tall array.
numObs = gather(length(ty)); % gather collects tall array into memorySet the seeds of the random number generators using rng and tallrng for reproducibility, and randomly select training samples. The results can vary depending on the number of workers and the execution environment for the tall arrays. For details, see Control Where Your Code Runs.
rng('default')
tallrng('default')
numTrain = floor(numObs/2);
[txTrain,trIdx] = datasample(tx,numTrain,'Replace',false);
tyTrain = ty(trIdx);
Fit a decision tree classifier model on the training samples.
mdl = fitctree(txTrain,tyTrain);
Evaluating tall expression using the Parallel Pool 'local':
- Pass 1 of 2: Completed in 3.9 sec
- Pass 2 of 2: Completed in 1.5 sec
Evaluation completed in 7.3 sec
Evaluating tall expression using the Parallel Pool 'local':
- Pass 1 of 4: Completed in 0.88 sec
- Pass 2 of 4: Completed in 1.6 sec
- Pass 3 of 4: Completed in 4 sec
- Pass 4 of 4: Completed in 2.7 sec
Evaluation completed in 11 sec
Evaluating tall expression using the Parallel Pool 'local':
- Pass 1 of 4: Completed in 0.54 sec
- Pass 2 of 4: Completed in 1.2 sec
- Pass 3 of 4: Completed in 3 sec
- Pass 4 of 4: Completed in 2 sec
Evaluation completed in 7.6 sec
Evaluating tall expression using the Parallel Pool 'local':
- Pass 1 of 4: Completed in 0.51 sec
- Pass 2 of 4: Completed in 1.3 sec
- Pass 3 of 4: Completed in 3.1 sec
- Pass 4 of 4: Completed in 2.5 sec
Evaluation completed in 8.5 sec
Evaluating tall expression using the Parallel Pool 'local':
- Pass 1 of 4: Completed in 0.42 sec
- Pass 2 of 4: Completed in 1.2 sec
- Pass 3 of 4: Completed in 3 sec
- Pass 4 of 4: Completed in 2.1 sec
Evaluation completed in 7.6 sec
Predict labels for the test samples by using the trained model.
txTest = tx(~trIdx,:);
label = predict(mdl,txTest);
Compute the confusion matrix for the resulting classification.
tyTest = ty(~trIdx);
[C,order] = confusionmat(tyTest,label)
C =

  M×N×... tall array

    ?    ?    ?    ...
    ?    ?    ?    ...
    ?    ?    ?    ...
    :    :    :
    :    :    :

Preview deferred. Learn more.


order =

  M×N×... tall array

    ?    ?    ?    ...
    ?    ?    ?    ...
    ?    ?    ?    ...
    :    :    :
    :    :    :

Preview deferred. Learn more.
Use the gather function to perform the deferred calculation and return the result of confusionmat in memory.
gather(C)
Evaluating tall expression using the Parallel Pool 'local':
- Pass 1 of 1: Completed in 1.9 sec
Evaluation completed in 2.3 sec
ans = 3×3

    20     0     0
     1    30     2
     0     0    22
gather(order)
Evaluating tall expression using the Parallel Pool 'local':
Evaluation completed in 0.032 sec
ans = 3×1 cell
    {'setosa'    }
    {'versicolor'}
    {'virginica' }
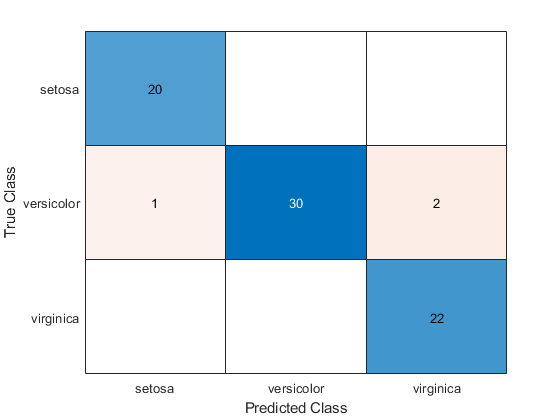
The confusion matrix shows that three measurements in the versicolor class are misclassified. All the measurements belonging to setosa and virginica are classified correctly.
To compute and plot the confusion matrix, use confusionchart instead.
cm = confusionchart(tyTest,label)
Evaluating tall expression using the Parallel Pool 'local':
- Pass 1 of 1: Completed in 0.34 sec
Evaluation completed in 0.6 sec
Evaluating tall expression using the Parallel Pool 'local':
- Pass 1 of 1: Completed in 0.48 sec
Evaluation completed in 0.67 sec
cm =
  ConfusionMatrixChart with properties:

    NormalizedValues: [3×3 double]
         ClassLabels: {3×1 cell}

  Show all properties
Use the confusionmat function to create a matrix showing the number of flights that travel between airports listed in the columns of a tall table.
When you perform calculations on tall arrays, MATLAB® uses either a parallel pool (default if you have Parallel Computing Toolbox™) or the local MATLAB session. To run the example using the local MATLAB session when you have Parallel Computing Toolbox, change the global execution environment by using the mapreducer function.
mapreducer(0)
Create a datastore for the airlinesmall.csv data set. Treat 'NA' values as missing data so that they are replaced with NaN values. Select the variables Origin and Dest to include in the datastore.
varnames = {'Origin','Dest'};
ds = datastore('airlinesmall.csv','TreatAsMissing','NA', ...
    'SelectedVariableNames',varnames);
Create a tall array for the data in the datastore. Because the data in ds is tabular, the result is a tall table. If the data is not tabular, then tall creates a tall cell array instead.
T = tall(ds)
T =

  M×2 tall table

    Origin      Dest
    _______    _______

    {'LAX'}    {'SJC'}
    {'SJC'}    {'BUR'}
    {'SAN'}    {'SMF'}
    {'BUR'}    {'SJC'}
    {'SMF'}    {'LAX'}
    {'LAX'}    {'SJC'}
    {'SAN'}    {'SFO'}
    {'SEA'}    {'LAX'}
       :          :
       :          :
The display of the tall table indicates that the number of rows of data is unknown.
Create a matrix showing the number of flights between columns T.Origin and T.Dest. This matrix is not a confusion matrix, because the two columns do not contain known and predicted values from classification. However, you can use the confusionmat function to create a matrix of frequencies.
[ta,tb] = confusionmat(T.Origin,T.Dest)
ta =

  M×N×... tall array

    ?    ?    ?    ...
    ?    ?    ?    ...
    ?    ?    ?    ...
    :    :    :
    :    :    :

Preview deferred. Learn more.


tb =

  M×N×... tall array

    ?    ?    ?    ...
    ?    ?    ?    ...
    ?    ?    ?    ...
    :    :    :
    :    :    :

Preview deferred. Learn more.
Perform the deferred calculation by using the gather function, and return the result of confusionmat in memory.
[freqMatrix,airportOrder] = gather(ta,tb);
Evaluating tall expression using the Local MATLAB Session:
- Pass 1 of 1: Completed in 0.55 sec
Evaluation completed in 0.82 sec
Display the first five rows of the matrix freqMatrix and the corresponding order of rows and columns airportOrder.
freqMatrix(1:5,:)
ans = 5×323

     0   153   169     0    91   161   322     0    44     6    56    24     0     0    23   180   122    20   150    20    63    77   134    37    10     0     3    51     0     1   311     0    15     0    32    81    30    53     0     9     2    15    12   293    20    38     1    73     0    41
   168     0    75    59     5    76     0     6    14    79     0     1     0     0     0    54    60     0     5     0     1     5    51     0     0     0     0     1     0     0    55     0     0     0     8    67    50     0     0     0     0    18     1    59     1     0     0    11     0     4
   187    87     0     0    78    39   120     0    14     1    18    19     0     0     0    98    95     2    19     3    14    14    72     0     0     0     0     0     0     0   108     0     1     0     1    31     4    14     0     1     0     3     9   172     5    13     0    21     0    10
     0    58     0     0    61    25    83     3     2     1     0     0     0     0     0     0    23     0     5     0     0     0    21     0     0     0     0     0     0     0    87     0     0     0     0    13     0     0     0     0     0     0     0    67     0     0     0     1     0     0
   114     1    88    73     0    70    20     5     4    47     1     3     0     0     0    40    39     0     1     0     0     3    57     0     0     0     0     0     0     0    50     0     1     0     1    28     1     0     0     0     0     0     2    58     5     0     0    21     0     0
airportOrder(1:5)
ans = 5×1 cell
    {'LAX'}
    {'SJC'}
    {'SAN'}
    {'BUR'}
    {'SMF'}
The matrix freqMatrix displays the number of flights from an origin airport (row) to a destination airport (column). For example, a total of 168 flights leave SJC and arrive at LAX (see freqMatrix(2,1)). Similarly, 88 flights leave SMF and arrive at SAN (see freqMatrix(5,3)). As noted earlier, freqMatrix is not a confusion matrix, but shows a count of flights between airports. As expected, the diagonal elements are all zeros, because the origin and destination airport are always different.
Input Arguments
Output Arguments
Alternative Functionality
Use
confusionchartto calculate and plot a confusion matrix. Additionally,confusionchartdisplays summary statistics about your data and sorts the classes of the confusion matrix according to the class-wise precision (positive predictive value), class-wise recall (true positive rate), or total number of correctly classified observations.