Main Content

fitdist

Fit probability distribution object to data

Description

example

pd = fitdist(x,distname) creates a probability distribution object by fitting the distribution specified by distname to the data in column vector x.

example

pd = fitdist(x,distname,Name,Value) creates the probability distribution object with additional options specified by one or more name-value pair arguments. For example, you can indicate censored data or specify control parameters for the iterative fitting algorithm.

example

[pdca,gn,gl] = fitdist(x,distname,'By',groupvar) creates probability distribution objects by fitting the distribution specified by distname to the data in x based on the grouping variable groupvar. It returns a cell array of fitted probability distribution objects, pdca, a cell array of group labels, gn, and a cell array of grouping variable levels, gl.

example

[pdca,gn,gl] = fitdist(x,distname,'By',groupvar,Name,Value) returns the above output arguments using additional options specified by one or more name-value pair arguments. For example, you can indicate censored data or specify control parameters for the iterative fitting algorithm.

Examples

collapse all

Fit a normal distribution to sample data, and examine the fit by using a histogram and a quantile-quantile plot.

Load patient weights from the data file patients.mat.

load patients
x = Weight;

Create a normal distribution object by fitting it to the data.

pd = fitdist(x,'Normal')
pd = 
  NormalDistribution

  Normal distribution
       mu =     154   [148.728, 159.272]
    sigma = 26.5714   [23.3299, 30.8674]

The distribution object display includes the parameter estimates for the mean (mu) and standard deviation (sigma), and the 95% confidence intervals for the parameters.

You can use the object functions of pd to evaluate the distribution and generate random numbers. Display the supported object functions.

methods(pd)
Methods for class prob.NormalDistribution:

cdf        gather     icdf       iqr        mean       median     negloglik  paramci    pdf        plot       proflik    random     std        truncate   var        

For example, obtain the 95% confidence intervals by using the paramci function.

ci95 = paramci(pd)
ci95 = 2×2

  148.7277   23.3299
  159.2723   30.8674

Specify the significance level (Alpha) to obtain confidence intervals with a different confidence level. Compute the 99% confidence intervals.

ci99 = paramci(pd,'Alpha',.01)
ci99 = 2×2

  147.0213   22.4257
  160.9787   32.4182

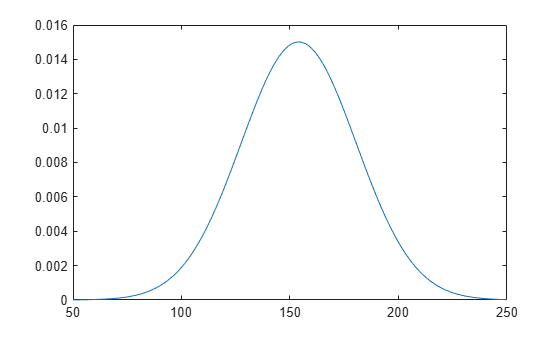
Evaluate and plot the pdf values of the distribution.

x_values = 50:1:250;
y = pdf(pd,x_values);
plot(x_values,y)

Figure contains an axes object. The axes object contains an object of type line.

Create a histogram with the normal distribution fit by using the histfit function. histfit uses fitdist to fit a distribution to data.

histfit(x)

Figure contains an axes object. The axes object contains 2 objects of type bar, line.

The histogram shows that the data has two modes, and that the mode of the normal distribution fit is between those two modes.

Use qqplot to create a quantile-quantile plot of the quantiles of the sample data x versus the theoretical quantile values of the fitted distribution.

qqplot(x,pd)

Figure contains an axes object. The axes object with title QQ Plot of Sample Data versus Distribution, xlabel Quantiles of normal Distribution, ylabel Quantiles of Input Sample contains 3 objects of type line. One or more of the lines displays its values using only markers

The plot is not a straight line, suggesting that the data does not follow a normal distribution.

Load patient weights from the data file patients.mat.

load patients
x = Weight;

Create a kernel distribution object by fitting it to the data. Use the Epanechnikov kernel function.

pd = fitdist(x,'Kernel','Kernel','epanechnikov')
pd = 
  KernelDistribution

    Kernel = epanechnikov
    Bandwidth = 14.3792
    Support = unbounded

Plot the pdf of the distribution.

x_values = 50:1:250;
y = pdf(pd,x_values);
plot(x_values,y)

Figure contains an axes object. The axes object contains an object of type line.

Load patient weights and genders from the data file patients.mat.

load patients
x = Weight;

Create normal distribution objects by fitting them to the data, grouped by patient gender.

[pdca,gn,gl] = fitdist(x,'Normal','By',Gender)
pdca=1×2 cell array
    {1x1 prob.NormalDistribution}    {1x1 prob.NormalDistribution}

gn = 2x1 cell
    {'Male'  }
    {'Female'}

gl = 2x1 cell
    {'Male'  }
    {'Female'}

The cell array pdca contains two probability distribution objects, one for each gender group. The cell array gn contains two group labels. The cell array gl contains two group levels.

View each distribution in the cell array pdca to compare the mean, mu, and the standard deviation, sigma, grouped by patient gender.

female = pdca{1}  % Distribution for females
female = 
  NormalDistribution

  Normal distribution
       mu = 180.532   [177.833, 183.231]
    sigma = 9.19322   [7.63933, 11.5466]

male = pdca{2}  % Distribution for males
male = 
  NormalDistribution

  Normal distribution
       mu = 130.472   [128.183, 132.76]
    sigma = 8.30339   [6.96947, 10.2736]

Compute the pdf of each distribution.

x_values = 50:1:250;
femalepdf = pdf(female,x_values);
malepdf = pdf(male,x_values);

Plot the pdfs for a visual comparison of weight distribution by gender.

figure
plot(x_values,femalepdf,'LineWidth',2)
hold on
plot(x_values,malepdf,'Color','r','LineStyle',':','LineWidth',2)
legend(gn,'Location','NorthEast')
hold off

Figure contains an axes object. The axes object contains 2 objects of type line. These objects represent Male, Female.

Load patient weights and genders from the data file patients.mat.

load patients
x = Weight;

Create kernel distribution objects by fitting them to the data, grouped by patient gender. Use a triangular kernel function.

[pdca,gn,gl] = fitdist(x,'Kernel','By',Gender,'Kernel','triangle');

View each distribution in the cell array pdca to see the kernel distributions for each gender.

female = pdca{1}  % Distribution for females
female = 
  KernelDistribution

    Kernel = triangle
    Bandwidth = 5.08961
    Support = unbounded

male = pdca{2}  % Distribution for males
male = 
  KernelDistribution

    Kernel = triangle
    Bandwidth = 4.25894
    Support = unbounded

Compute the pdf of each distribution.

x_values = 50:1:250;
femalepdf = pdf(female,x_values);
malepdf = pdf(male,x_values);

Plot the pdfs for a visual comparison of weight distribution by gender.

figure
plot(x_values,femalepdf,'LineWidth',2)
hold on
plot(x_values,malepdf,'Color','r','LineStyle',':','LineWidth',2)
legend(gn,'Location','NorthEast')
hold off

Figure contains an axes object. The axes object contains 2 objects of type line. These objects represent Male, Female.

Input Arguments

collapse all

Input data, specified as a column vector. fitdist ignores NaN values in x. Additionally, any NaN values in the censoring vector or frequency vector cause fitdist to ignore the corresponding values in x.

Data Types: double

Distribution name, specified as one of the following character vectors or string scalars. The distribution specified by distname determines the type of the returned probability distribution object.

Distribution NameDescriptionDistribution Object
'Beta'Beta distributionBetaDistribution
'Binomial'Binomial distributionBinomialDistribution
'BirnbaumSaunders'Birnbaum-Saunders distributionBirnbaumSaundersDistribution
'Burr'Burr distributionBurrDistribution
'Exponential'Exponential distributionExponentialDistribution
'Extreme Value' or 'ev'Extreme Value distributionExtremeValueDistribution
'Gamma'Gamma distributionGammaDistribution
'Generalized Extreme Value' or 'gev'Generalized Extreme Value distributionGeneralizedExtremeValueDistribution
'Generalized Pareto' or 'gp'Generalized Pareto distributionGeneralizedParetoDistribution
'Half Normal' or 'hn'Half-normal distributionHalfNormalDistribution
'InverseGaussian'Inverse Gaussian distributionInverseGaussianDistribution
'Kernel'Kernel distributionKernelDistribution
'Logistic'Logistic distributionLogisticDistribution
'Loglogistic'Loglogistic distributionLoglogisticDistribution
'Lognormal'Lognormal distributionLognormalDistribution
'Nakagami'Nakagami distributionNakagamiDistribution
'Negative Binomial' or 'nbin'Negative Binomial distributionNegativeBinomialDistribution
'Normal'Normal distributionNormalDistribution
'Poisson'Poisson distributionPoissonDistribution
'Rayleigh'Rayleigh distributionRayleighDistribution
'Rician'Rician distributionRicianDistribution
'Stable'Stable distributionStableDistribution
'tLocationScale't Location-Scale distributiontLocationScaleDistribution
'Weibull' or 'wbl'Weibull distributionWeibullDistribution

Grouping variable, specified as a categorical array, logical or numeric vector, character array, string array, or cell array of character vectors. Each unique value in a grouping variable defines a group.

For example, if Gender is a cell array of character vectors with values 'Male' and 'Female', you can use Gender as a grouping variable to fit a distribution to your data by gender.

More than one grouping variable can be used by specifying a cell array of grouping variables. Observations are placed in the same group if they have common values of all specified grouping variables.

For example, if Smoker is a logical vector with values 0 for nonsmokers and 1 for smokers, then specifying the cell array {Gender,Smoker} divides observations into four groups: Male Smoker, Male Nonsmoker, Female Smoker, and Female Nonsmoker.

Example: {Gender,Smoker}

Data Types: categorical | logical | single | double | char | string | cell

Name-Value Arguments

Specify optional pairs of arguments as Name1=Value1,...,NameN=ValueN, where Name is the argument name and Value is the corresponding value. Name-value arguments must appear after other arguments, but the order of the pairs does not matter.

Before R2021a, use commas to separate each name and value, and enclose Name in quotes.

Example: fitdist(x,'Kernel','Kernel','triangle') fits a kernel distribution object to the data in x using a triangular kernel function.

Logical flag for censored data, specified as a vector of logical values that is the same size as input vector x. The value is 1 when the corresponding element in x is a right-censored observation and 0 when the corresponding element is an exact observation. The default is a vector of 0s, indicating that all observations are exact.

fitdist ignores any NaN values in this censoring vector. Additionally, any NaN values in x or the frequency vector cause fitdist to ignore the corresponding values in the censoring vector.

This argument is valid only if distname is 'BirnbaumSaunders', 'Burr', 'Exponential', 'ExtremeValue', 'Gamma', 'InverseGaussian', 'Kernel', 'Logistic', 'Loglogistic', 'Lognormal', 'Nakagami', 'Normal', 'Rician', 'tLocationScale', or 'Weibull'.

Data Types: logical

Observation frequency, specified as a vector of nonnegative integer values that is the same size as input vector x. Each element of the frequency vector specifies the frequencies for the corresponding elements in x. The default is a vector of 1s, indicating that each value in x only appears once.

fitdist ignores any NaN values in this frequency vector. Additionally, any NaN values in x or the censoring vector cause fitdist to ignore the corresponding values in the frequency vector.

Data Types: single | double

Control parameters for the iterative fitting algorithm, specified as a structure you create using statset.

Data Types: struct

Number of trials for the binomial distribution, specified as a positive integer value.

This argument is valid only when distname is 'Binomial' (binomial distribution).

Example: 'Ntrials',10

Data Types: single | double

Location (threshold) parameter for the generalized Pareto distribution, specified as a scalar.

This argument is valid only when distname is 'Generalized Pareto' (generalized Pareto distribution).

The default value is 0 when the sample data x includes only nonnegative values. You must specify theta if x includes negative values.

Example: 'theta',1

Data Types: single | double

Location parameter for the half-normal distribution, specified as a scalar.

This argument is valid only when distname is 'Half Normal' (half-normal distribution).

The default value is 0 when the sample data x includes only nonnegative values. You must specify mu if x includes negative values.

Example: 'mu',1

Data Types: single | double

Kernel smoother type for the kernel distribution, specified as one of the following:

  • 'normal'

  • 'box'

  • 'triangle'

  • 'epanechnikov'

You must specify distname as 'Kernel' to use this option.

Kernel density support for the kernel distribution, specified as 'unbounded', 'positive', or a two-element vector.

ValueDescription
'unbounded'Density can extend over the whole real line.
'positive'Density is restricted to positive values.

Alternatively, you can specify a two-element vector giving finite lower and upper limits for the support of the density.

You must specify distname as 'Kernel' to use this option.

Data Types: single | double | char | string

Bandwidth of the kernel smoothing window for the kernel distribution, specified as a scalar value. The default value used by fitdist is optimal for estimating normal densities, but you might want to choose a smaller value to reveal features such as multiple modes. You must specify distname as 'Kernel' to use this option.

Data Types: single | double

Output Arguments

collapse all

Probability distribution, returned as a probability distribution object. The distribution specified by distname determines the class type of the returned probability distribution object. For the list of distname values and corresponding probability distribution objects, see distname.

Probability distribution objects of the type specified by distname, returned as a cell array. For the list of distname values and corresponding probability distribution objects, see distname.

Group labels, returned as a cell array of character vectors.

Grouping variable levels, returned as a cell array of character vectors containing one column for each grouping variable.

Algorithms

The fitdist function fits most distributions using maximum likelihood estimation. Two exceptions are the normal and lognormal distributions with uncensored data.

  • For the uncensored normal distribution, the estimated value of the sigma parameter is the square root of the unbiased estimate of the variance.

  • For the uncensored lognormal distribution, the estimated value of the sigma parameter is the square root of the unbiased estimate of the variance of the log of the data.

Alternative Functionality

  • The Distribution Fitter app opens a graphical user interface for you to import data from the workspace and interactively fit a probability distribution to that data. You can then save the distribution to the workspace as a probability distribution object. Open the Distribution Fitter app using distributionFitter, or click Distribution Fitter on the Apps tab.

  • To fit a distribution to left-censored, double-censored, or interval-censored data, use mle. You can find the maximum likelihood estimates by using the mle function, and create a probability distribution object by using the makedist function. For an example, see Find MLEs for Double-Censored Data.

References

[1] Johnson, N. L., S. Kotz, and N. Balakrishnan. Continuous Univariate Distributions. Vol. 1, Hoboken, NJ: Wiley-Interscience, 1993.

[2] Johnson, N. L., S. Kotz, and N. Balakrishnan. Continuous Univariate Distributions. Vol. 2, Hoboken, NJ: Wiley-Interscience, 1994.

[3] Bowman, A. W., and A. Azzalini. Applied Smoothing Techniques for Data Analysis. New York: Oxford University Press, 1997.

Extended Capabilities

Version History

Introduced in R2009a