Main Content

cluster

Construct clusters from Gaussian mixture distribution

Description

example

idx = cluster(gm,X) partitions the data in X into k clusters determined by the k Gaussian mixture components in gm. The value in idx(i) is the cluster index of observation i and indicates the component with the largest posterior probability given the observation i.

[idx,nlogL] = cluster(gm,X) also returns the negative loglikelihood of the Gaussian mixture model gm given the data X.

[idx,nlogL,P] = cluster(gm,X) also returns the posterior probabilities of each Gaussian mixture component in gm given each observation in X.

[idx,nlogL,P,logpdf] = cluster(gm,X) also returns a logarithm of the estimated probability density function (pdf) evaluated at each observation in X.

[idx,nlogL,P,logpdf,d2] = cluster(gm,X) also returns the squared Mahalanobis distance of each observation in X to each Gaussian mixture component in gm.

Examples

collapse all

Generate random variates that follow a mixture of two bivariate Gaussian distributions by using the mvnrnd function. Fit a Gaussian mixture model (GMM) to the generated data by using the fitgmdist function. Then, use the cluster function to partition the data into two clusters determined by the fitted GMM components.

Define the distribution parameters (means and covariances) of two bivariate Gaussian mixture components.

mu1 = [2 2];          % Mean of the 1st component
sigma1 = [2 0; 0 1];  % Covariance of the 1st component
mu2 = [-2 -1];        % Mean of the 2nd component
sigma2 = [1 0; 0 1];  % Covariance of the 2nd component

Generate an equal number of random variates from each component, and combine the two sets of random variates.

rng('default') % For reproducibility
r1 = mvnrnd(mu1,sigma1,1000);
r2 = mvnrnd(mu2,sigma2,1000);
X = [r1; r2];

The combined data set X contains random variates following a mixture of two bivariate Gaussian distribution.

Fit a two-component GMM to X.

gm = fitgmdist(X,2);

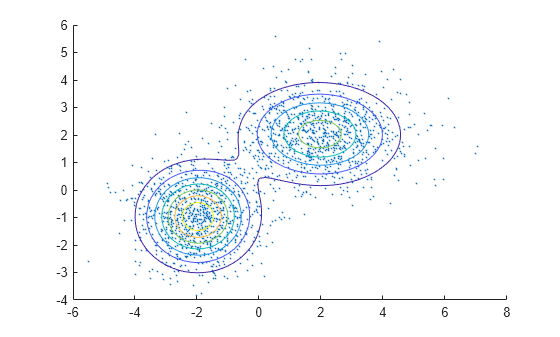
Plot X by using scatter. Visualize the fitted model gm by using pdf and fcontour.

figure
scatter(X(:,1),X(:,2),10,'.') % Scatter plot with points of size 10
hold on
gmPDF = @(x,y) arrayfun(@(x0,y0) pdf(gm,[x0 y0]),x,y);
fcontour(gmPDF,[-6 8 -4 6])

Figure contains an axes object. The axes object contains 2 objects of type scatter, functioncontour.

Partition the data into clusters by passing the fitted GMM and the data to cluster.

idx = cluster(gm,X);

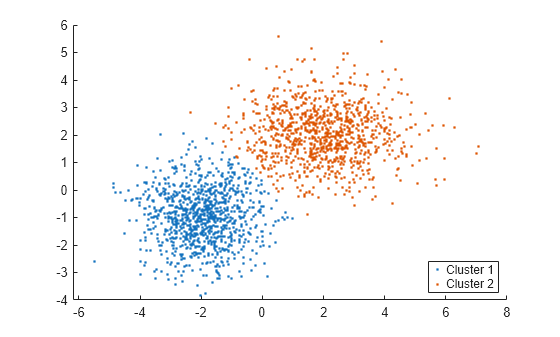
Use gscatter to create a scatter plot grouped by idx.

figure;
gscatter(X(:,1),X(:,2),idx);
legend('Cluster 1','Cluster 2','Location','best');

Figure contains an axes object. The axes object contains 2 objects of type line. One or more of the lines displays its values using only markers These objects represent Cluster 1, Cluster 2.

Input Arguments

collapse all

Gaussian mixture distribution, also called Gaussian mixture model (GMM), specified as a gmdistribution object.

You can create a gmdistribution object using gmdistribution or fitgmdist. Use the gmdistribution function to create a gmdistribution object by specifying the distribution parameters. Use the fitgmdist function to fit a gmdistribution model to data given a fixed number of components.

Data, specified as an n-by-m numeric matrix, where n is the number of observations and m is the number of variables in each observation.

To provide meaningful clustering results, X must come from the same population as the data used to create gm.

If a row of X contains NaNs, then cluster excludes the row from the computation. The corresponding value in idx, P, logpdf, and d2 is NaN.

Data Types: single | double

Output Arguments

collapse all

Cluster index, returned as an n-by-1 positive integer vector, where n is the number of observations in X.

idx(i) is the cluster index of observation i and indicates the Gaussian mixture component with the largest posterior probability given the observation i.

Negative loglikelihood value of the Gaussian mixture model gm given the data X, returned as a numeric value.

Posterior probability of each Gaussian mixture component in gm given each observation in X, returned as an n-by-k numeric vector, where n is the number of observations in X and k is the number of mixture components in gm.

P(i,j) is the posterior probability of the jth Gaussian mixture component given observation i, Probability(component j | observation i).

Logarithm of the estimated pdf, evaluated at each observation in X, returned as an n-by-1 numeric vector, where n is the number of observations in X.

logpdf(i) is the logarithm of the estimated pdf at observation i. The cluster function computes the estimated pdf by using the likelihood of each component given each observation and the component probabilities.

logpdf(i)=logj=1kL(Cj|Oi)P(Cj),

where L(Cj|Oj) is the likelihood of component j given observation i, and P(Cj) is the probability of component j. The cluster function computes the likelihood term by using the multivariate normal pdf of the jth Gaussian mixture component evaluated at observation i. The component probabilities are the mixing proportions of mixture components, the ComponentProportion property of gm.

Squared Mahalanobis distance of each observation in X to each Gaussian mixture component in gm, returned as an n-by-k numeric matrix, where n is the number of observations in X and k is the number of mixture components in gm.

d2(i,j) is the squared distance of observation i to the jth Gaussian mixture component.

Version History

Introduced in R2007b